从零开始,视具体情况而定。选择坐标比例尺极为重要,若比例尺选择不当,会使曲线的 某些特性如极大、极小、转折点等表达得不清楚,甚至导致错误的结论 比例尺的选择 ·般应遵循下列规则 .有效数字和坐标纸的大小。应能表示出全部有效数字,使从作图法求出物理量的精 确度与测量时的精确度相一致。 b.比例尺的选择。应使每一点在坐标纸上的数值都能迅速方便地找到。因此,图纸坐 标每小格(最小分度值)所代表的数值, 一般应取1、2、5及其10倍数等值 曲线的走向 在满足上述要求下 ,还应考虑充分利用图纸的全部面积,使全图布局 匀称合理,在双变量的处理过程中引入最小的绘图误差 .若图形为直线或近似直线的曲线,则比例尺的选择应使其倾斜角接近于45度: 3)画坐标轴。 比例尺洗定后,画上华标轴,在轴亲注明该轴所代表的物理量及单位。在描轴下面及 纵轴左边 每 定距离写下该处变量的轴刻度尺的标称值, 以便于做图及读数 一般不 要将实验值写在轴旁或测量点务。 4)测量点的绘制。 将测得的数值,以几何点的形式描绘于图上,并在点的周围画上圆圈、三角、方块或 其他符号(如:⊙◇·△X口等等),其点周围符号面积的大小可相应代表测量的精确度 如若测量的精确度很高,圆等应绘制小些,反之,则应大些 特别应注意 张图纸上,如有几组测量数据,需用不同的符号来表示,以示区别 并在图区空白等处加以注明。 5)绘制曲线。 作出各测量点后,用直尺、曲线板或曲线尺作出尽可能接近于各点的曲线,曲线应光 滑均匀,细而清晰。曲线不必通过所有各点,但分布在曲线两旁的点数应近似相等。点和 曲线间的距离, 表示测量的“绝对”误着 状况。 理论上进 使曲线和实验点之间的距离 的平方和为最小(即最小二乘法原理)。并且曲线两旁各点与曲线间的距离,也应近于相等 6)书写图名。 曲线绘制好后,应写上图名和主要的测量条件,如温度、压力等。 正确地洗用绘图工县也是作好图的关键之一。作图所需的工具右铅笋、直尺、曲线板 曲线尺、圆规等。铅笔以使用中等硬度例如1H为宜。 (2)图解徽分方法 物理化学实验中,有的实验结果不能简单地从上述所绘制的图形中直接读出。因此, 如何从己得的图形或曲线来进一步计算与处理,以获得所需结果的技术是十分重要的。常 用的图解技术有:内插、外推、计算直线的斜率和藏距、图解微分、图解积分以及曲线的 直线化等,下面仅介绍图解微分方法。 图解微分的中心问题是如何准确地在曲线上作切线。作切线的方法很多,以镜像法最 为简便可靠,即若需在曲线上指定的点Q处作切线,可应用镜像法先作该点法线,再作法 线的垂直线即切线。 取一有直边的平而薄的镜子垂直放在图上,使其边缘 AB放在曲线的横断面上:然后绕Q点转动,直到镜外曲 线与镜象曲线成一连续光滑的曲线时,沿镜面AB边作 直线,此直线即为曲线在该Q点上的法线。通过Q点作法 线AB的垂线即为该点上曲线的切线,如图1-1所示
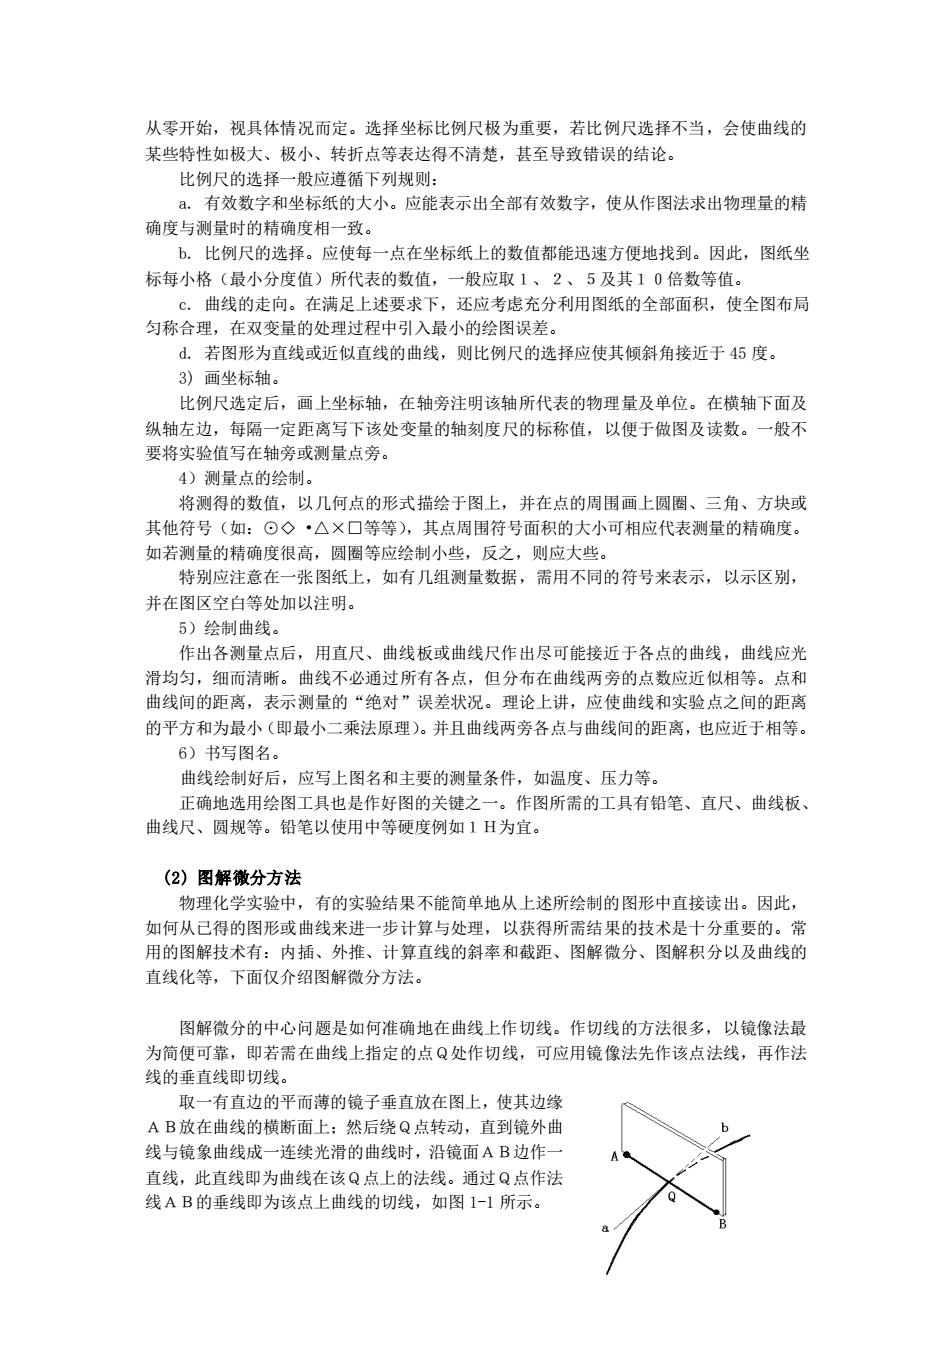
从零开始,视具体情况而定。选择坐标比例尺极为重要,若比例尺选择不当,会使曲线的 某些特性如极大、极小、转折点等表达得不清楚,甚至导致错误的结论。 比例尺的选择一般应遵循下列规则: a. 有效数字和坐标纸的大小。应能表示出全部有效数字,使从作图法求出物理量的精 确度与测量时的精确度相一致。 b. 比例尺的选择。应使每一点在坐标纸上的数值都能迅速方便地找到。因此,图纸坐 标每小格(最小分度值)所代表的数值,一般应取1、2、5及其10倍数等值。 c. 曲线的走向。在满足上述要求下,还应考虑充分利用图纸的全部面积,使全图布局 匀称合理,在双变量的处理过程中引入最小的绘图误差。 d. 若图形为直线或近似直线的曲线,则比例尺的选择应使其倾斜角接近于 45 度。 3) 画坐标轴。 比例尺选定后,画上坐标轴,在轴旁注明该轴所代表的物理量及单位。在横轴下面及 纵轴左边,每隔一定距离写下该处变量的轴刻度尺的标称值,以便于做图及读数。一般不 要将实验值写在轴旁或测量点旁。 4)测量点的绘制。 将测得的数值,以几何点的形式描绘于图上,并在点的周围画上圆圈、三角、方块或 其他符号(如:⊙◇ •△×□等等),其点周围符号面积的大小可相应代表测量的精确度。 如若测量的精确度很高,圆圈等应绘制小些,反之,则应大些。 特别应注意在一张图纸上,如有几组测量数据,需用不同的符号来表示,以示区别, 并在图区空白等处加以注明。 5)绘制曲线。 作出各测量点后,用直尺、曲线板或曲线尺作出尽可能接近于各点的曲线,曲线应光 滑均匀,细而清晰。曲线不必通过所有各点,但分布在曲线两旁的点数应近似相等。点和 曲线间的距离,表示测量的“绝对”误差状况。理论上讲,应使曲线和实验点之间的距离 的平方和为最小(即最小二乘法原理)。并且曲线两旁各点与曲线间的距离,也应近于相等。 6)书写图名。 曲线绘制好后,应写上图名和主要的测量条件,如温度、压力等。 正确地选用绘图工具也是作好图的关键之一。作图所需的工具有铅笔、直尺、曲线板、 曲线尺、圆规等。铅笔以使用中等硬度例如1H为宜。 (2) 图解微分方法 物理化学实验中,有的实验结果不能简单地从上述所绘制的图形中直接读出。因此, 如何从已得的图形或曲线来进一步计算与处理,以获得所需结果的技术是十分重要的。常 用的图解技术有:内插、外推、计算直线的斜率和截距、图解微分、图解积分以及曲线的 直线化等,下面仅介绍图解微分方法。 图解微分的中心问题是如何准确地在曲线上作切线。作切线的方法很多,以镜像法最 为简便可靠,即若需在曲线上指定的点Q处作切线,可应用镜像法先作该点法线,再作法 线的垂直线即切线。 取一有直边的平而薄的镜子垂直放在图上,使其边缘 AB放在曲线的横断面上;然后绕Q点转动,直到镜外曲 线与镜象曲线成一连续光滑的曲线时,沿镜面AB边作一 直线,此直线即为曲线在该Q点上的法线。通过Q点作法 线AB的垂线即为该点上曲线的切线,如图 1-1 所示。 图 1-1 镜像法绘制法线
求出切线的斜率,即微商值,可继续进行后续的数据处理。 (3)坐标变换方法 在所有的图形中以直线最为简单,若两个变数间(自变数与因变数间)成直线关系 那么此两变数的关系可以用y=ax十b来表示,x为自变数,y为因变数,a及b为常数 常数a及b确定后即可以求出x与y的关系。如果两个变数并非直线关系,亦常常可以通 时改换变量而成直线。 例如在物理化学中常常碰到指数函数k=Ax(一,则其自然对数的表达式为: 后+d 即转换为线性方程(y=ax十b),若以1n为纵坐标,以1/T为横坐标,也可以得到一直 线 又例如理想气体方程P=RT,经过变换绘制(P1/图可得直线关系。 (4)图解法的应用 1)求内插值。 根据实验所得数据,以自变量作横轴,因变量作纵轴,画出两变量间的关系曲线,可 在曲线所示范围内,找出与某一变量相应的另一变量的数值。如工作曲线的应用。 2)求外推 在极限条件下 不能或不易由实验直接测得的一些物理量数值,则可利用测量数据间 的线性关系,外推至测量范围以外,求得某一函数的极限值,这种方法称为外推法。 例如:强电解质无限稀溶液的摩尔电导数值不能由实验直接测定,但可通过直接测定 多个浓度较稀溶液的摩尔电导,应用强电解质溶液理论处理实验数据,然后作图外推至浓 度为0,即可得到无限稀溶液的摩尔电导 3)作切线 图数的微商。 从曲线的斜率求函数的微商,在物化实验数据处理中经常应用。 例如:测定不同浓度溶液的表面张力后,则须从表面张力一浓度曲线上作切线,求得 定浓度时表面张力随浓度的变化率⑦σc,然后通过吉布斯公式,计算吸附量。 4)求经验公式中的常数。 若函数间有线性关系或经函数变换后具有线性关系,均可用作图法求出式中的常数。 例如化学动力学中的阿累尼乌斯公式:=Aexp(-E/RT) 两边取对数令其直线化(1nk=lnkE刊RD,以lnk对1/T作图,可得一条直线。由直线 的斜率和截距,可分别求出活化能E和碰撞频率A的数值。 5)求函数的极值或转折点 这是作图法的最大优点之一,物化实验数据处理中求函数的极值或转折点,均采用作 图法。 例如,二元恒沸混合物的最低或最高恒沸点及其组成的测定:大分子电解质溶液的等 电点等 4.数学方程法 一些实验数据用列表法或图形法表示后,有时还需用数学方程将实验中各变量数据间 的相互关系表示出来,这种方法称为数学方程法。 其优点在于表达方式简单,也便于求微分、积分和内插值。许多实验方程式中系数的
求出切线的斜率,即微商值,可继续进行后续的数据处理。 (3)坐标变换方法 在所有的图形中以直线最为简单,若两个变数间(自变数与因变数间)成直线关系, 那么此两变数的关系可以用y=ax+b来表示,x为自变数,y为因变数,a及b为常数。 常数a及b确定后即可以求出x与y的关系。如果两个变数并非直线关系,亦常常可以通 过改换变量而成直线。 例如在物理化学中常常碰到指数函数 k=A . exp(-E/RT),则其自然对数的表达式为: ln k= - RT E +lnA 即转换为线性方程(y=ax+b),若以 ln k 为纵坐标,以 1/T 为横坐标,也可以得到一直 线。 又例如理想气体方程 PV=nRT,经过变换绘制(P~1/V)图可得直线关系。 (4) 图解法的应用 1)求内插值。 根据实验所得数据,以自变量作横轴,因变量作纵轴,画出两变量间的关系曲线,可 在曲线所示范围内,找出与某一变量相应的另一变量的数值。如工作曲线的应用。 2)求外推值。 在极限条件下,不能或不易由实验直接测得的一些物理量数值,则可利用测量数据间 的线性关系,外推至测量范围以外,求得某一函数的极限值,这种方法称为外推法。 例如:强电解质无限稀溶液的摩尔电导数值不能由实验直接测定,但可通过直接测定 多个浓度较稀溶液的摩尔电导,应用强电解质溶液理论处理实验数据,然后作图外推至浓 度为0,即可得到无限稀溶液的摩尔电导。 3)作切线求函数的微商。 从曲线的斜率求函数的微商,在物化实验数据处理中经常应用。 例如:测定不同浓度溶液的表面张力后,则须从表面张力-浓度曲线上作切线,求得一 定浓度时表面张力随浓度的变化率 c ,然后通过吉布斯公式,计算吸附量。 4)求经验公式中的常数。 若函数间有线性关系或经函数变换后具有线性关系,均可用作图法求出式中的常数。 例如化学动力学中的阿累尼乌斯公式:k=A∙exp(-E/RT) 两边取对数令其直线化(lnk=lnA-E/RT),以 lnk 对 1/T 作图,可得一条直线。由直线 的斜率和截距,可分别求出活化能E和碰撞频率A的数值。 5)求函数的极值或转折点。 这是作图法的最大优点之一,物化实验数据处理中求函数的极值或转折点,均采用作 图法。 例如,二元恒沸混合物的最低或最高恒沸点及其组成的测定;大分子电解质溶液的等 电点等。 4. 数学方程法 一些实验数据用列表法或图形法表示后,有时还需用数学方程将实验中各变量数据间 的相互关系表示出来,这种方法称为数学方程法。 其优点在于表达方式简单,也便于求微分、积分和内插值。许多实验方程式中系数的
数值,常对应于某一物理量,因此为了求得此物理量,将数据归钠总结为经验方程式,也 是非常必要的, (1)寻求数学方程的一般方法。 当各变量间的解析依赖关系为未知时,一般可按下列步骤寻求其数学关系式: 1)确定自变量和应变量,作图,绘出曲线。 2)将所得曲线形状与已知函数的曲线形状比较 3)根据比较结果 ,应用坐标变换变量方法,重新作图,使原曲线线性化 4)计算线性方程的常数。 5)若曲线无法线性化,可将原函数表示成自变量的多项式,即: =0+bx+c+d2+ 应用测量数据进行数学拟合求各常数项。多项式次数的多少,以结果能表示的可靠程度 在实验误差范围以内为准 (②)直线方程常数的求法 1)图解法 将实验数据在直角坐标纸上作图,若得一直线,即可用线性方程式表示,其常数项可 用下述方法求得 a. 可在原点坐标系中将直线延长交于X轴和Y轴,直接读取相应的常数项 b.在直线上取点,应用数学的两点法求得方程的斜率和截距:为减少计算误差,所取 两点不宜相隔太近,一般在直线的两端附近选取直线上的点。 2)最小二乘法 最小二乘法的基本思路是:最佳结果应能使标准误差最小,所以残差(数学方程计算 值与测量值之差)的平方和应为最小。应用数学极值方法进行处理可得到相应的计算公式 中的常数项。最小二乘法计算虽然比较麻烦,但得到的结果可靠,应用计算机进行处理是很 易进行的。 第三节计算机的应用 计算机的使用越来越普及,相应的各种通用应用软件也很多,如Excel,Word和WPs 等数据和文字处理软件。很多实验的测量数据可以采用计算机处理软件进行处理并绘制简 单的直线或曲线图:也可应用专用软件进行处理数据,连接微机控制的或采集数据的实验, 如微分溶解热实验,氧弹燃烧热实验或B-反应实验等。 详细的内容和使用请参阅专业资料和专用说明书,在此简略。 Experiment 2 Saturated Vapor Pressure of Pure Liquids 1.Obiective 1.1 To comprehend the definition of saturated vapor pressure for pure liquids and the concept of equilibrium between gas and liquid; 1.2 To gain an insight into the relationship between temperature and the saturated vapor pressure of liquids-Clausius-Clapeyron equation
数值,常对应于某一物理量,因此为了求得此物理量,将数据归纳总结为经验方程式,也 是非常必要的。 (1) 寻求数学方程的一般方法。 当各变量间的解析依赖关系为未知时,一般可按下列步骤寻求其数学关系式: 1)确定自变量和应变量,作图,绘出曲线。 2)将所得曲线形状与已知函数的曲线形状比较。 3)根据比较结果,应用坐标变换变量方法,重新作图,使原曲线线性化。 4)计算线性方程的常数。 5)若曲线无法线性化,可将原函数表示成自变量的多项式,即: y= a+bx+cx 2+dx 3+. 应用测量数据进行数学拟合求各常数项。多项式次数的多少,以结果能表示的可靠程度 在实验误差范围以内为准。 (2)直线方程常数的求法 1) 图解法 将实验数据在直角坐标纸上作图,若得一直线,即可用线性方程式表示,其常数项可 用下述方法求得。 a. 可在原点坐标系中将直线延长交于 X 轴和 Y 轴,直接读取相应的常数项。 b. 在直线上取点,应用数学的两点法求得方程的斜率和截距;为减少计算误差,所取 两点不宜相隔太近,一般在直线的两端附近选取直线上的点。 2)最小二乘法 最小二乘法的基本思路是:最佳结果应能使标准误差最小,所以残差(数学方程计算 值与测量值之差)的平方和应为最小。应用数学极值方法进行处理可得到相应的计算公式 中的常数项。最小二乘法计算虽然比较麻烦,但得到的结果可靠,应用计算机进行处理是很 易进行的。 第三节 计算机的应用 计算机的使用越来越普及,相应的各种通用应用软件也很多,如 Excel,Word 和 WPS 等数据和文字处理软件。很多实验的测量数据可以采用计算机处理软件进行处理并绘制简 单的直线或曲线图;也可应用专用软件进行处理数据,连接微机控制的或采集数据的实验, 如微分溶解热实验,氧弹燃烧热实验或 B-Z 反应实验等。 详细的内容和使用请参阅专业资料和专用说明书,在此简略。 Experiment 2 Saturated Vapor Pressure of Pure Liquids 1. Objective 1.1 To comprehend the definition of saturated vapor pressure for pure liquids and the concept of equilibrium between gas and liquid; 1.2 To gain an insight into the relationship between temperature and the saturated vapor pressure of liquids—Clausius-Clapeyron equation
1.3 To determine the saturated vapor pressure of cyclohexane at different temperature using vacuum gauge,to master the elementary experimental technique for low vacuum operation. 1.4 To lear the way to obtain the average molar enthalpy of vaporization of the examine liquid over a range of temperatures using graphical method as well as its normal boiling point under ambient pressure 2.Introduction The saturated vapor pressure of a pure liquid is defined as the pressure of the vapor existing in equilibrium with the liquid at a specified temperature.Here,the equilibrium state refers to a dynamicquilbrim.Ata specified temperature,for a liquid system occluded in a sealed vacuum vessel the molecular species escape from the liquid surface forming the vapor phase,and meanwhile the liquid is regenerated by condensation of the vapor molecules through collision.A dynamic equilibrium will be attained if the rates of the above two processes become equal,and thereafter the density of the vapor in the gas phase will retain a fixed value,which is called the saturation vapor pressure of the liquid. The vapor pressure of a pure liquid varies with temperature.Their relation could be expressed as the Clausius-Clapeyronquation (2-2-1) Where p*is the vapor pressure of the pure liquid at temperature T.T is the thermodynamic temperature.AH is the molar enthalpy of vaporization;R is the ideal gas constant.Within a moderate range of temperature,Hcould be considered as a constant,namely,the average molar enthalpy of vaporization.Integrating the Equation(2-2-1),one can obtain: np=-42+c (2-2-2) R T where Cis the integration constant,which is related to the units of p From Equation (2-2-2),it is obvious that after measuring the vapor pressures at various
1.3 To determine the saturated vapor pressure of cyclohexane at different temperature using vacuum gauge; to master the elementary experimental technique for low vacuum operation. 1.4 To learn the way to obtain the average molar enthalpy of vaporization of the examine liquid over a range of temperatures using graphical method as well as its normal boiling point under ambient pressure. 2. Introduction The saturated vapor pressure of a pure liquid is defined as the pressure of the vapor existing in equilibrium with the liquid at a specified temperature. Here, the equilibrium state refers to a dynamic equilibrium. At a specified temperature, for a liquid system occluded in a sealed vacuum vessel the molecular species escape from the liquid surface forming the vapor phase, and meanwhile the liquid is regenerated by condensation of the vapor molecules through collision. A dynamic equilibrium will be attained if the rates of the above two processes become equal, and thereafter the density of the vapor in the gas phase will retain a fixed value, which is called the saturation vapor pressure of the liquid. The vapor pressure of a pure liquid varies with temperature. Their relation could be expressed as the Clausius-Clapeyron equation dT d ln p * = 2 RT V Hm (2-2−1) Where P* is the vapor pressure of the pure liquid at temperature T; T is the thermodynamic temperature; V Hm is the molar enthalpy of vaporization; R is the ideal gas constant. Within a moderate range of temperature, V Hm could be considered as a constant, namely, the average molar enthalpy of vaporization. Integrating the Equation (2-2-1), one can obtain: ln p = − R V Hm C T + 1 (2-2−2) where C is the integration constant, which is related to the units of P*. From Equation (2-2-2), it is obvious that after measuring the vapor pressures at various
temperatures within a moderate temperature range,a straight line can be obtained by plotting Inp* against 1/T.The average molar enthalpy of the liquid in this temperature range could be estimated from the slope of the straight line.The temperature at which the saturated vapor pressure of the liquid becomes equal to ambient pressure (101.325 kPa)is called the normal boiling point of the liquid Thus,the plot of the straight line can also be used to obtain thenormal boiling point of the liquid. There are a number of ways to measure vapor pressures,such as the dynamic method,the static method,the saturated flow method and etc.In this experiment the static method is used,ie.,the iquid is placed in a sealed system,and then its vapor pressures at various temperatures and boiling points at various pressures are measured.This method is appropriate for measuring liquids with relatively large vapor pressures 3.Apparatus and Reagent Apparatus for vapor pressure determination;Barometer with digital output;Thermometer(two pieces):Magnetic stirrer:Vacuum pump,Electric heater,Vacuum gauge with digital output. Cyclohexane (AR) 4.Procedure 4.1.Setting up the apparatus Make sure that all conections are air-tight.The balance tube comprises three interconnected glass tubes,i.e tube a,b and c.The liquid is stored in tubea and the two connected tubes b and care also filled with the liquid.Ifonly pure vapor exists above the liquid in tubes aand cand the levels of the liquid in tubes,the vapor pressure above the liquid in tothe ambient pressure applied on the liquid in tube b.Then,the liquid temperature is the equilibrium temperature of the gas-liquid system,namely,the boiling point of the liquid
temperatures within a moderate temperature range, a straight line can be obtained by plotting lnP* against 1/T. The average molar enthalpy of vaporization v Hm of the liquid in this temperature range could be estimated from the slope of the straight line. The temperature at which the saturated vapor pressure of the liquid becomes equal to ambient pressure (101.325 kPa) is called the normal boiling point of the liquid. Thus, the plot of the straight line can also be used to obtain the normal boiling point of the liquid. There are a number of ways to measure vapor pressures, such as the dynamic method, the static method, the saturated flow method and etc. In this experiment the static method is used, i.e., the liquid is placed in a sealed system, and then its vapor pressures at various temperatures and boiling points at various pressures are measured. This method is appropriate for measuring liquids with relatively large vapor pressures. 3. Apparatus and Reagent Apparatus for vapor pressure determination; Barometer with digital output; Thermometer (two pieces); Magnetic stirrer; Vacuum pump; Electric heater; Vacuum gauge with digital output; Cyclohexane (AR). 4. Procedure 4.1. Setting up the apparatus Make sure that all connections are air-tight. The balance tube comprises three interconnected glass tubes, i.e. tube a, b and c. The liquid is stored in tube a, and the two connected tubes b and c are also filled with the liquid. If only pure vapor exists above the liquid in tubes a and c and the levels of the liquid in tubes b and c are equal, the vapor pressure above the liquid in tube c is equal to the ambient pressure applied on the liquid in tube b. Then, the liquid temperature is the equilibrium temperature of the gas-liquid system, namely, the boiling point of the liquid