第二章统计假设测验及T测验 第一节理论分布与抽样分布 Sampling distributions 第二节统计假设测验 Test of statistical hypothesis 第三节平均数的假设检验 Test of mean hypothesis 第四节二项资料的百分数假设检验 Test of percent hypothesis 第五节参数的区间估计 Estimate of confidence interval
第二章 统计假设测验及T测验 第一节 理论分布与抽样分布 Sampling distributions 第二节 统计假设测验 Test of statistical hypothesis 第三节 平均数的假设检验 Test of mean hypothesis 第四节 二项资料的百分数假设检验 Test of percent hypothesis 第五节 参数的区间估计 Estimate of confidence interval
第一节理论分布与抽样分布 Sampling Distributions l.二项式分布Binomial distribution 2.泊松分布Poisson distribution 3.正态分布Normal Distribution 4.抽样分布Sampling distribution
第一节 理论分布与抽样分布 Sampling Distributions 1. 二项式分布 Binomial distribution 2. 泊松分布 Poisson distribution 3. 正态分布 Normal Distribution 4. 抽样分布 Sampling distribution
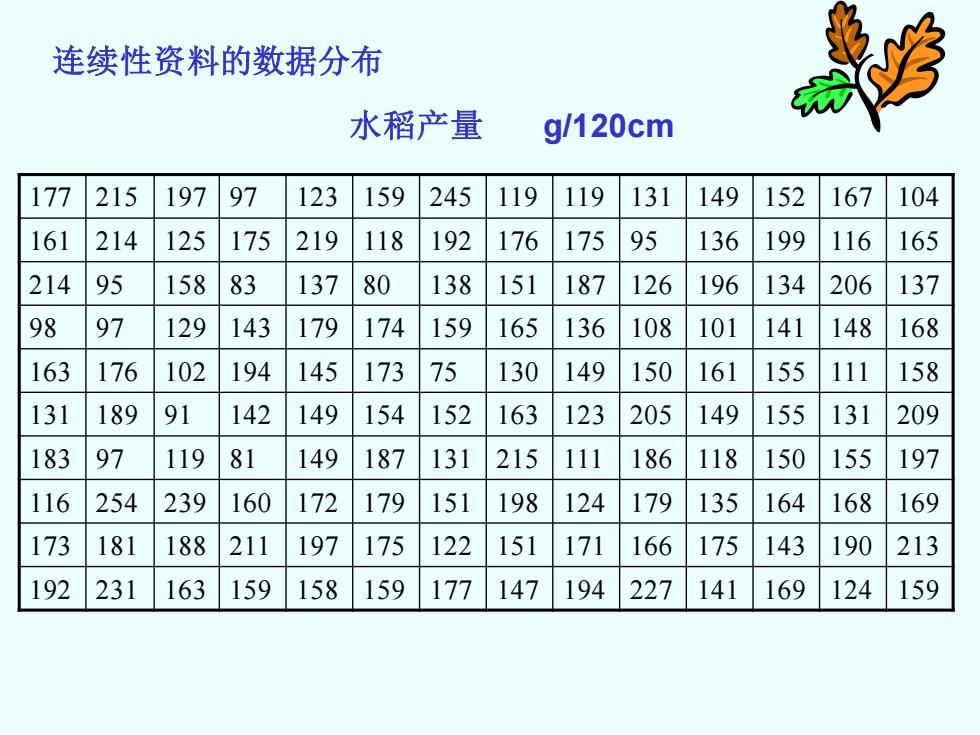
连续性资料的数据分布 水稻产量 g/120cm 177 215 197 97 123 159 245 119 119 131 149 152 167 104 161 214 125 175 219 118 192 176 175 95 136 199 116 165 214 95 158 83 137 80 138 151 187 126 196 134 206 137 98 97 129 143 179 174 159 165 136 108 101 141 148 168 163 176 102 194 145 173 75 130 149 150 161 155 111 158 131 189 91 142 149 154 152 163 123 205 149 155 131 209 183 97 119 81 149 187 131 215 111 186 118 150 155 197 116 254 239 160 172 179 151 198 124 179 135 164 168 169 173 181 188 211 197 175 122 151 171 166 175 143 190 213 192 231 163 159 158 159 177 147 194 227 141 169 124 159
连续性资料的数据分布 177 215 197 97 123 159 245 119 119 131 149 152 167 104 161 214 125 175 219 118 192 176 175 95 136 199 116 165 214 95 158 83 137 80 138 151 187 126 196 134 206 137 98 97 129 143 179 174 159 165 136 108 101 141 148 168 163 176 102 194 145 173 75 130 149 150 161 155 111 158 131 189 91 142 149 154 152 163 123 205 149 155 131 209 183 97 119 81 149 187 131 215 111 186 118 150 155 197 116 254 239 160 172 179 151 198 124 179 135 164 168 169 173 181 188 211 197 175 122 151 171 166 175 143 190 213 192 231 163 159 158 159 177 147 194 227 141 169 124 159 水稻产量 g/120cm

整理结果 分组数列 组中点值 次数(f) 67.582.5 75 2 0。 82.5~97.5 90 7 .oo.o 97.5≈112.5 105 7 ·00●年4。 112.5~127.5 120 40e00eeee●ew 13 127.5142.5 135 15 142.5157.5 150 20 157.5172.5 165 000·000··。00e0.0000e。0。 25 172.5187.5 180 21 187.5≈202.5 195 13 202.5≈217.5 210 9 217.5232.5 225 3 4。 232.5~247.5 240 2 247.5~262.5 255 1 总次数(n) 140
整理结果 分组数列 组中点值 次数(f) 67.5 ~ 82.5 75 . 2 82.5 ~ 97.5 90 . 7 97.5 ~ 112.5 105 . 7 112.5 ~ 127.5 120 . 13 127.5 ~ 142.5 135 . 15 142.5 ~ 157.5 150 . 20 157.5 ~ 172.5 165 . 25 172.5 ~ 187.5 180 . 21 187.5 ~ 202.5 195 . 13 202.5 ~ 217.5 210 . 9 217.5 ~ 232.5 225 . 3 232.5 ~ 247.5 240 . 2 247.5 ~ 262.5 255 . 1 总次数 (n) 140
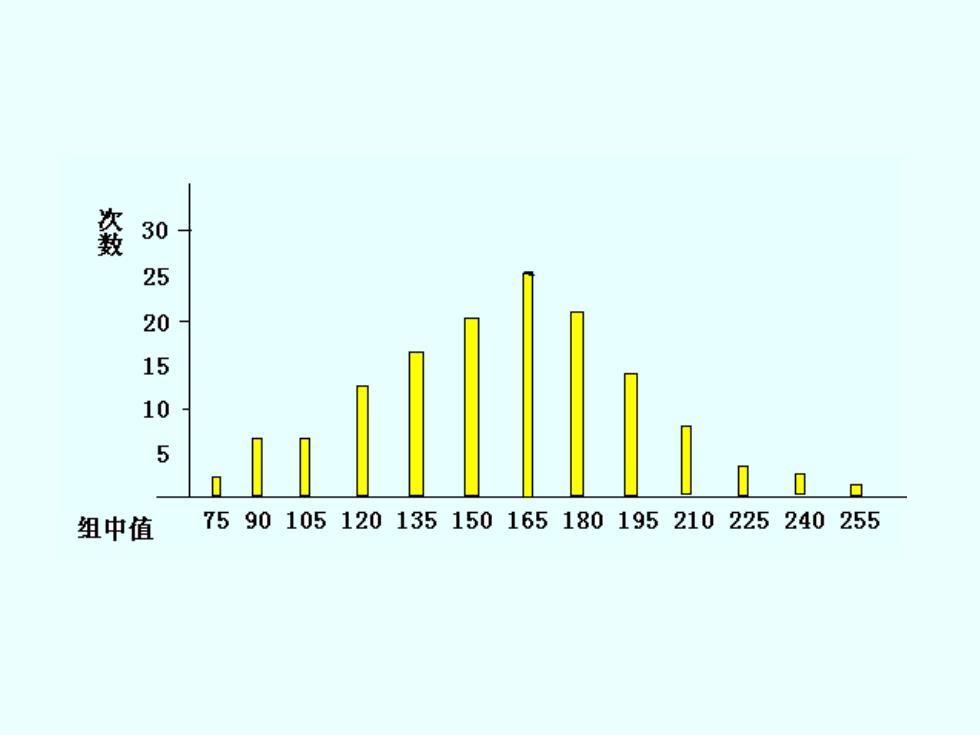
姦 30- 25 20 15 10 5 0 组中值 7590105120135150165180195210225240255