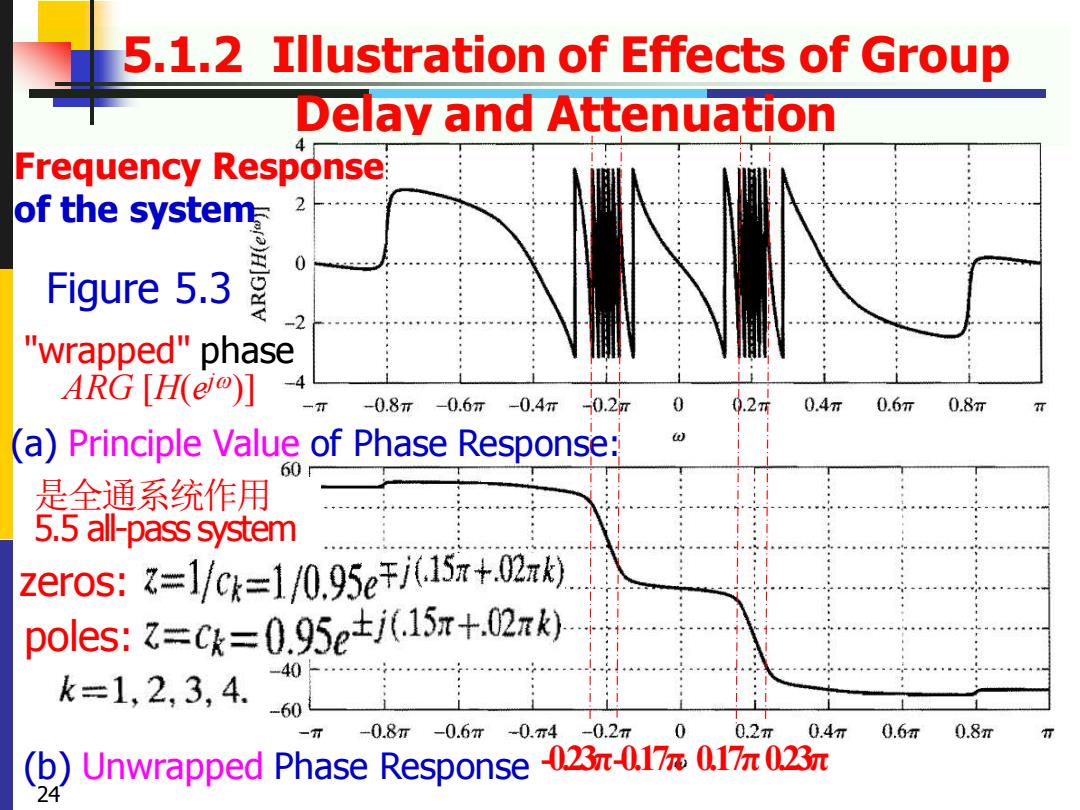
5.1.2 Illustration of Effects of Group Delay and Attenuation Frequency Response of the system 2 Figure 5.3 -2 "wrapped"phase ARG [H(i)] -0.8m-0.6m-0.4m 0.2m 0 0.2m 0.4r 0.6m 0.8m (a)Principle Value of Phase Response: 60 是全通系统作用 5.5 all-pass system zeros:=1/Ck=1/0.95eFj(157+.02k) poles:=Ck=0.95ej(157+.02nk) -40 k=1.2,3,4. -0.8r-0.6m -0.m4-0.2m0 0.2r 0.4r 0.6m 0.8r (b)Unwrapped Phase Response -023n-0.17 0.17 023m
5.1.2 Illustration of Effects of Group Delay and Attenuation (a) Principle Value of Phase Response: (b) Unwrapped Phase Response Figure 5.3 24 -0.23π-0.17π 0.17π0.23π Frequency Response of the system 是全通系统作用 5.5 all-pass system zeros: poles: "wrapped" phase ARG [H(e j )]
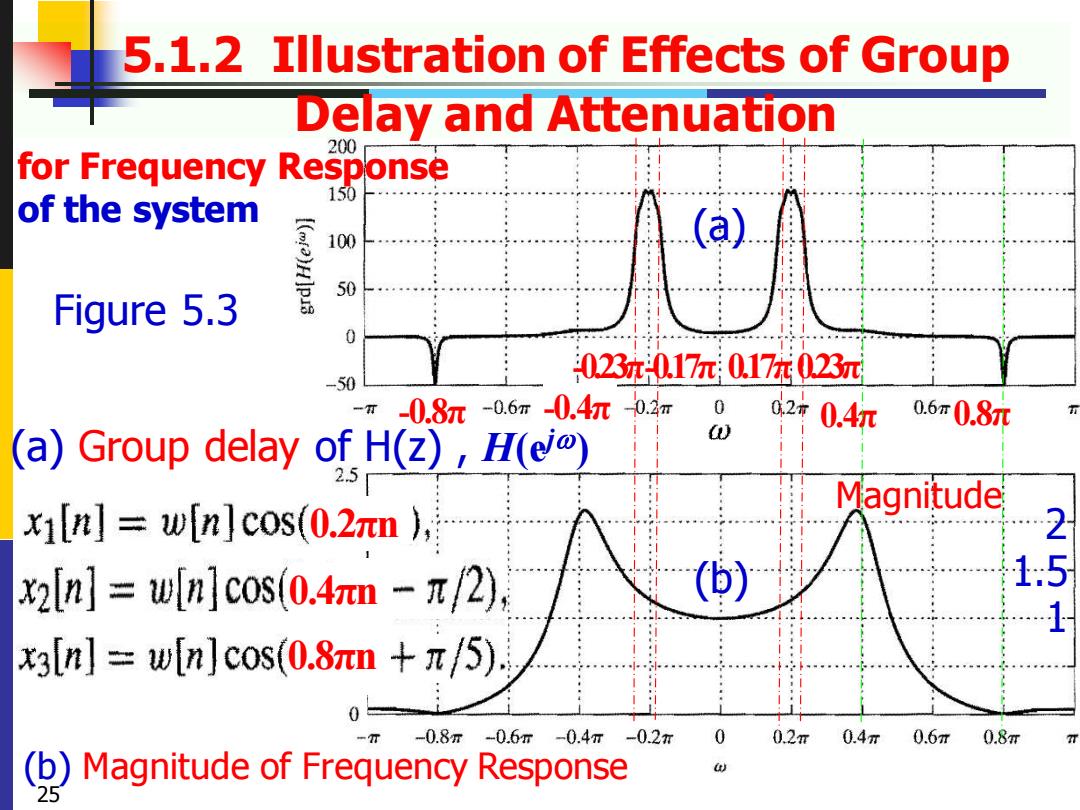
5.1.2 Illustration of Effects of Group Delay and Attenuation 200 for Frequency Response 150 of the system a [(a)H]p3 100 50 Figure 5.3 0 023π0.17m0.17π023π -50 -0.8m-0.6m-0.4r02m 02年0.4 0.6m0.8m (a)Group delay of H(z),H(ej) 2.5 Magnitude x][n]w[n]cos(0.2nn ) 2 x2[n]w[n]cos(0.4nn -/2) 1.5 x3[n]=w[n]cos(0.8πn+π/5) -0.8m-0.6π-0.4m-02r 0 0.2π 0.4r 0.6m 0.8π ()Magnitude of Frequency Response
5.1.2 Illustration of Effects of Group Delay and Attenuation (a) Group delay of H(z) , H(e j ) (b) Magnitude of Frequency Response Figure 5.3 25 -0.23π-0.17π 0.17π0.23π 0.2πn 0.4πn 0.8πn -0.8π -0.4π 0.4π 0.8π 1 2 1.5 for Frequency Response of the system (a) (b) Magnitude
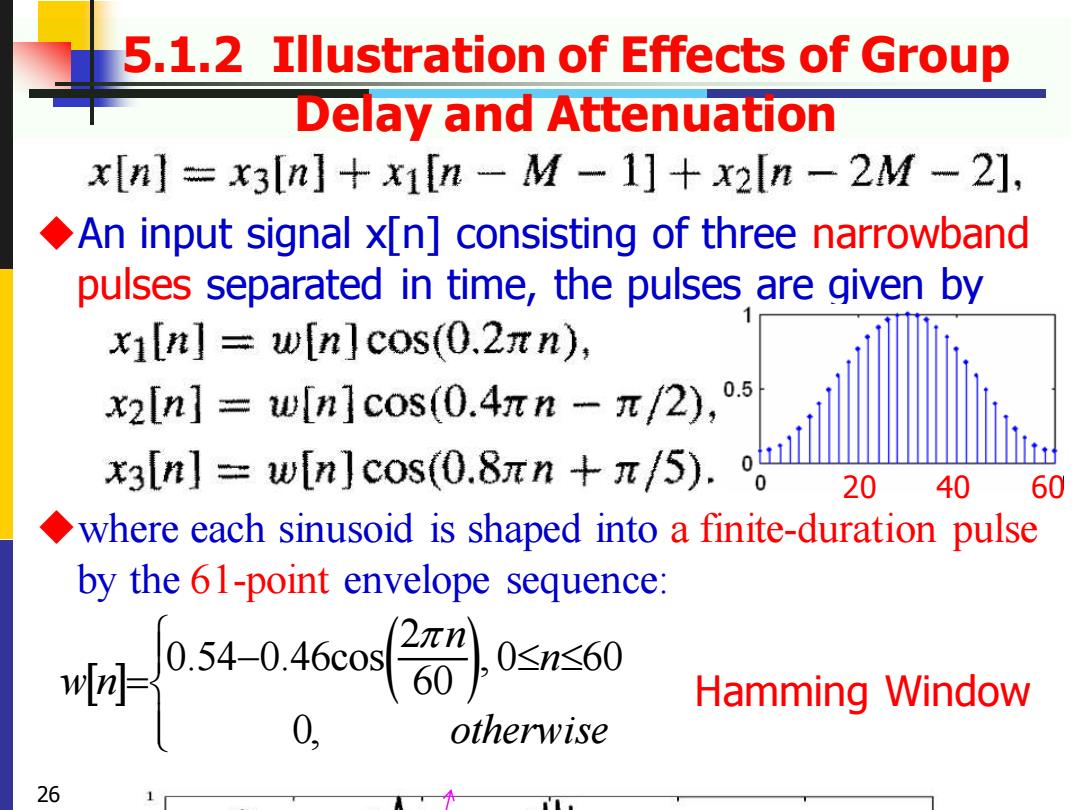
5.1.2 Illustration of Effects of Group Delay and Attenuation x[n]=x3[n]+x1[n-M-1]+X2[n-2M-2], An input signal x[n]consisting of three narrowband pulses separated in time,the pulses are given by xi[n]w[n]cos(0.2nn), x2[n]=w[n]cos(0.4rn-π/2),o5 x3[n]=w[n]cos(0.8πn+π/5.il 20 40 60 where each sinusoid is shaped into a finite-duration pulse by the 61-point envelope sequence: n ,0≤1≤60 Hamming Window otherwise 26
5.1.2 Illustration of Effects of Group Delay and Attenuation ◆An input signal x[n] consisting of three narrowband pulses separated in time, the pulses are given by ◆where each sinusoid is shaped into a finite-duration pulse by the 61-point envelope sequence: 26 Hamming Window 20 40 60 ( ) 2 0.54 0.46cos , 0 60 60 0, n n w n otherwise − =
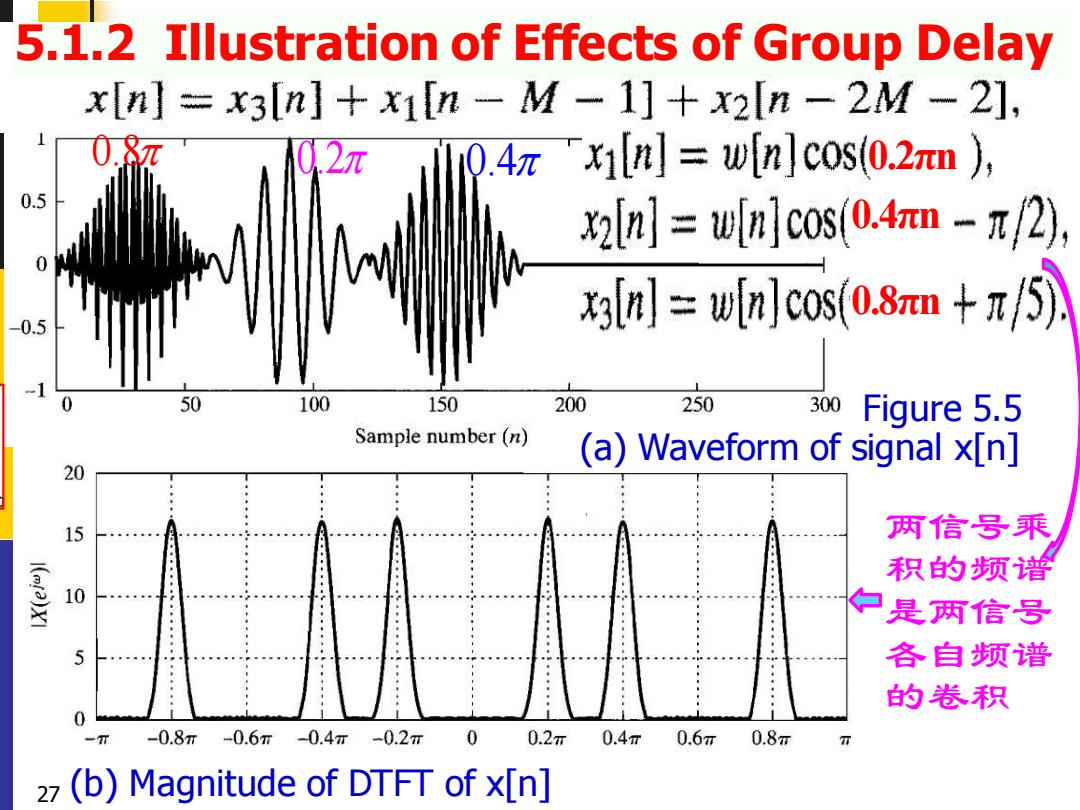
5.1.2 Illustration of Effects of Group Delay x[n]=x3[n]+x1[n-M-1]+x2n-2M-2], 0.8π 0.2元 10.4 xIn]=w[n]cos(0.2nn ) 0.5 x2[n]=w[n]cos(0.4n -/2) 3[n=]coso.8m+z/5の, 0.5 50 100 150 200 250 300 Figure 5.5 Sample number(n) (a)Waveform of signal x[n] 20 15 两信号乘 I(f2)XI 积的频曾 10 白是两信号 各自频谱 的卷积 0 -0.8m -0.6m -0.4π -0.2r 0 0.2π 0.4 0.6m 0.8π 27 (b)Magnitude of DTFT of x[n]
5.1.2 Illustration of Effects of Group Delay and Attenuation Figure 5.5 (a) Waveform of signal x[n] (b) Magnitude of DTFT of x[n] 0.8 0.2 0.4 27 0.2πn 0.4πn 0.8πn 两信号乘 积的频谱 是两信号 各自频谱 的卷积
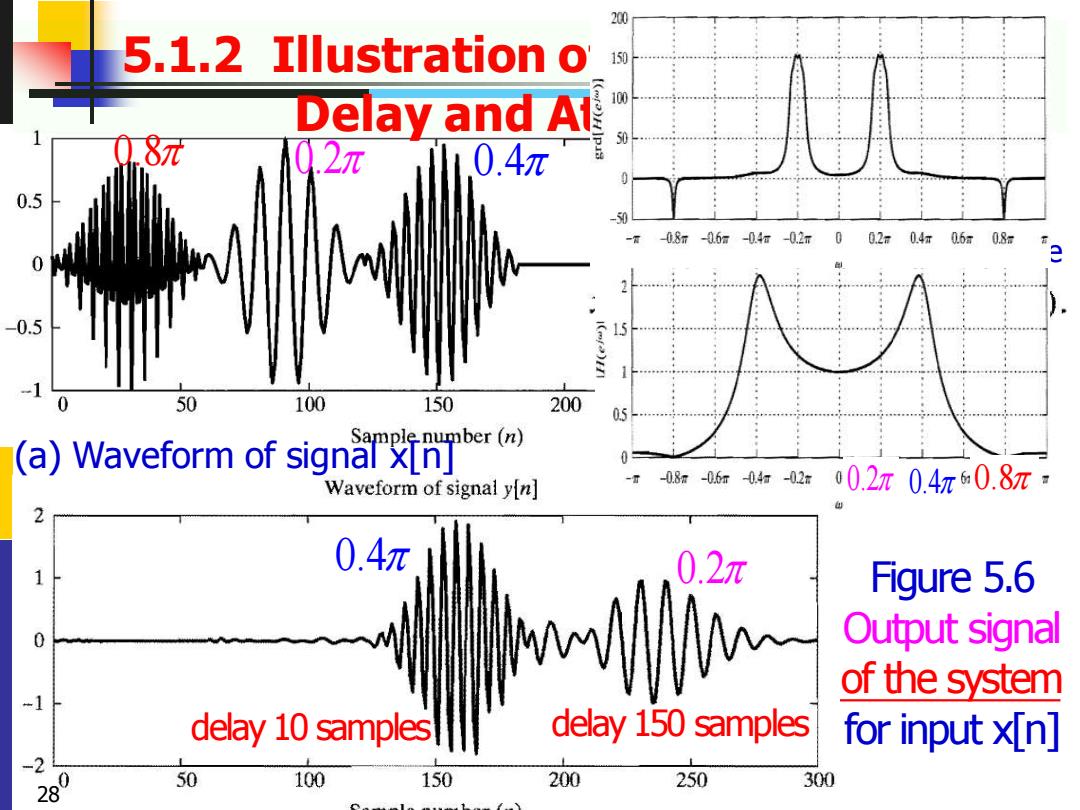
200 5.1.2 Illustration o 150 100 Delay and Al 50 8元 0.2元 0.4π 0.5 50 -g08m-0.6a-0.4行-02m00.2a04r0.6r08= 50 100 150 200 Samplenumber(n) (a)Waveform of signal x[n] Waveform of signal yfn] -T -0.8m0.6r04r-02a 00.2r0.4r0.8m 2 0.4r 0.2m Figure 5.6 0 Output signal of the system -1 delay 10 samples delay 150 samples for input x[n] -2 0 50 100 150 200 250 300
5.1.2 Illustration of Effects of Group Delay and Attenuation Figure 5.5 (a) Waveform of signal x[n] Figure 5.6 Output signal of the system for input x[n] 0.8 0.2 0.4 0.2 0.4 delay 10 samples delay 150 samples Group delay Magnitude Frequency Response 28 0.2 0.4 0.8