2.2 1.Fiscal policy at home 52 An increase in G or decrease in T NX reduces saving. Results: △I=0 △X=△S<0 I(r) 1 SI CHAPTER 8 The Open Economy slide 17
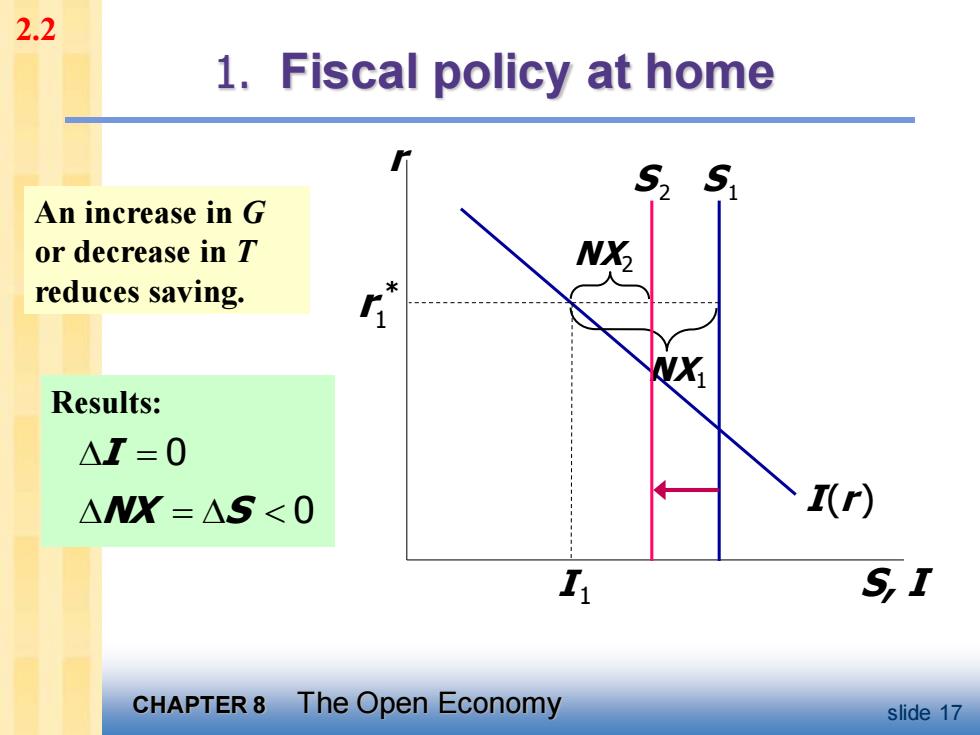
CHAPTER 8 The Open Economy slide 17 1. Fiscal policy at home r S, I I(r ) S 1 I 1 An increase in G or decrease in T reduces saving. 1 * r NX1 S 2 NX2 Results: = I 0 = NX S 0 2.2
2.2 NX and the Government Budget Deficit 8 Percent Budget deficit Percent of GDP 3 (right scale) 6 of GDP 2 2 2 Net exports (left scale) 6 1 11 111111111111111111111111111111111111111 8 1950 1960 1970 1980 1990 2000 CHAPTER 8 The Open Economy slide 18
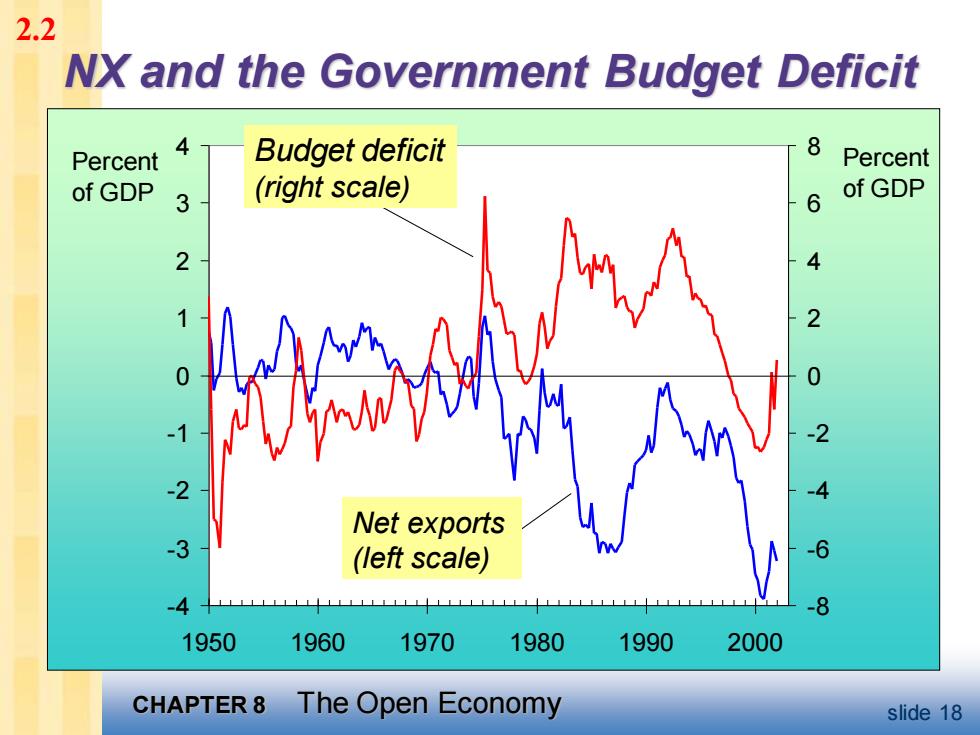
CHAPTER 8 The Open Economy slide 18 NX and the Government Budget Deficit -4 -3 -2 -1 0 1 2 3 4 1950 1960 1970 1980 1990 2000 Percent of GDP -8 -6 -4 -2 0 2 4 6 8 Percent of GDP Budget deficit (right scale) Net exports (left scale) 2.2