附件24.4 n=N o /N i=1.59*P*Q/(M"n) 6.Schematic Diagram of Hydraulic system 0 ① Figure 3-1 Schematic Diagram of Hydraulic system 7.Experimental procedure This experiment is based in the Laboratory Furniture of Qinchuang Qcs003 type Start hydraulic pump 18 and make the solenoid valve 17 stay in the neutral position, Solenoid valve 13 normal.(Refer to Figure 4-3) Close the throttle valve 10. Regulate the Pressure relief valve 11 to make the pressure higher than the rated pressure of hydraulic pump-Set the value of Pressure relief valve at 70Kgf/cm2 And then regulate throttle valve to make pump bear the different load and detect the corresponding measured pressure P,flow rate Q,the torque M,rotational Speed or input power of electric motor Note:Detect the relevant data 1-2 minute later when the test is running after each throttle adjustment Pressure P:Measured by the pressure gauge P
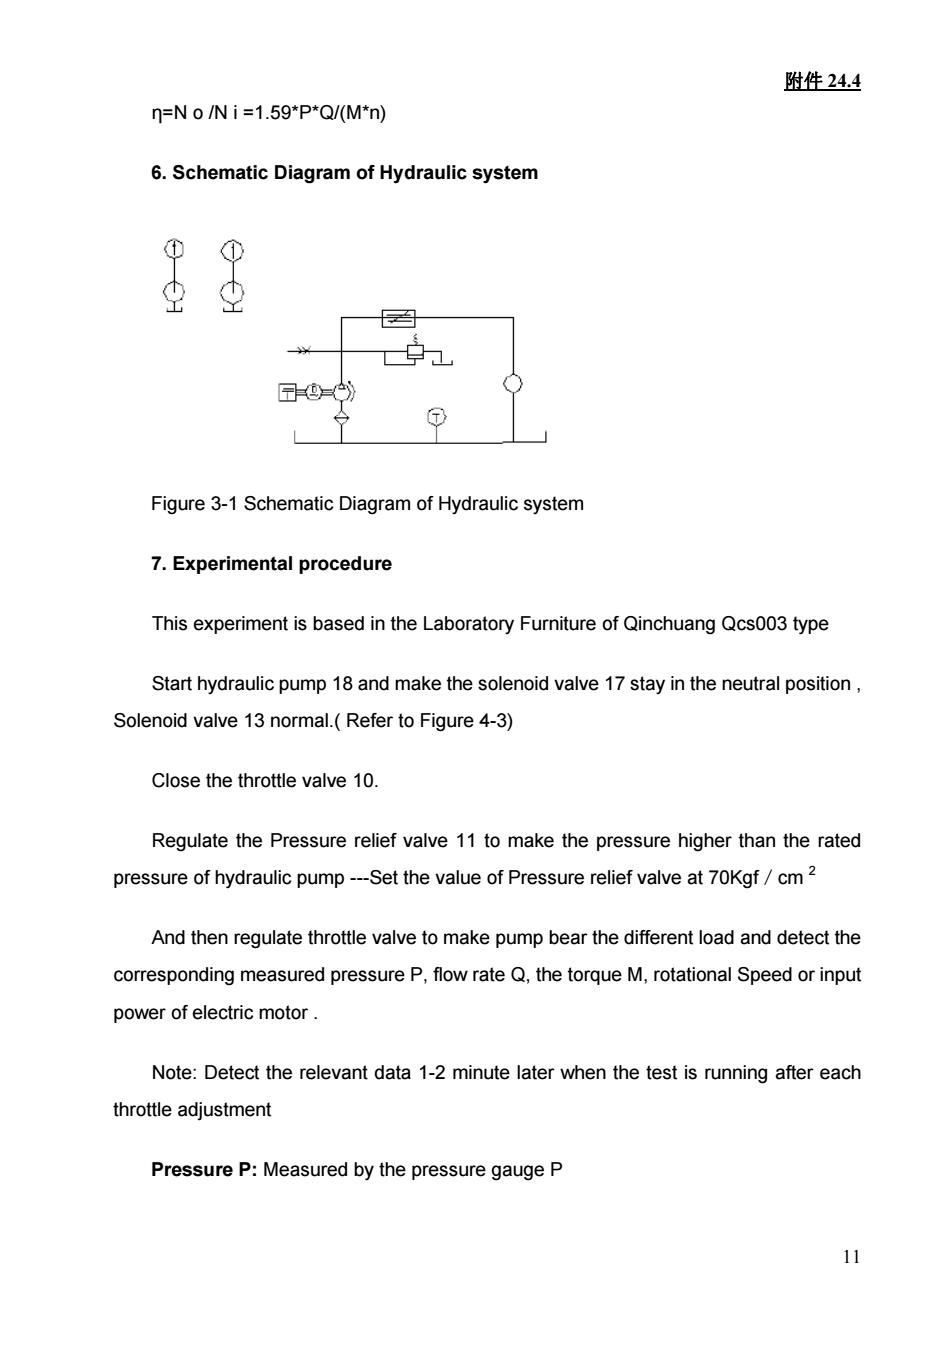
附件 24.4 11 η=N o /N i =1.59*P*Q/(M*n) 6. Schematic Diagram of Hydraulic system Figure 3-1 Schematic Diagram of Hydraulic system 7. Experimental procedure This experiment is based in the Laboratory Furniture of Qinchuang Qcs003 type Start hydraulic pump 18 and make the solenoid valve 17 stay in the neutral position , Solenoid valve 13 normal.( Refer to Figure 4-3) Close the throttle valve 10. Regulate the Pressure relief valve 11 to make the pressure higher than the rated pressure of hydraulic pump -Set the value of Pressure relief valve at 70Kgf/cm 2 And then regulate throttle valve to make pump bear the different load and detect the corresponding measured pressure P, flow rate Q, the torque M, rotational Speed or input power of electric motor . Note: Detect the relevant data 1-2 minute later when the test is running after each throttle adjustment Pressure P: Measured by the pressure gauge P

附件24.4 Flow rate Q:Measured the Difference cumulant every minute AV by oval wheel flow meter. Q=△Vt*60(Wmin) t-is the time required as the Volume change by AV Torque M:measured by Motor balance method.As shown in Figure 3-2 M=G*1(kgf"m) Rotational Speed:Measured by Mechanical tachometer 8.Answer the questions as follows (1)What is the role of relief valves in hydraulic system of laboratory Furniture (2)Why the throttle can make the tested pump loaded in hydraulic system of laboratory Furniture. (3)What is the difference between the rated flow rate and theoretical flow rate. (4)Where the main leakage of pump generate? (5)If the hydraulic pump has the best operating point?Why? (6)What is the loss of the hydraulic pump?Why it could be neglected in the calculation? 2
附件 24.4 12 Flow rate Q: Measured the Difference cumulant every minute △V by oval wheel flow meter. Q=△V/t*60(l/min) t—is the time required as the Volume change by △V Torque M: measured by Motor balance method. As shown in Figure 3-2 M=G*1(kgf*m) Rotational Speed: Measured by Mechanical tachometer 8. Answer the questions as follows (1) What is the role of relief valves in hydraulic system of laboratory Furniture. (2) Why the throttle can make the tested pump loaded in hydraulic system of laboratory Furniture. (3) What is the difference between the rated flow rate and theoretical flow rate. (4) Where the main leakage of pump generate? (5) If the hydraulic pump has the best operating point? Why? (6)What is the loss of the hydraulic pump? Why it could be neglected in the calculation?