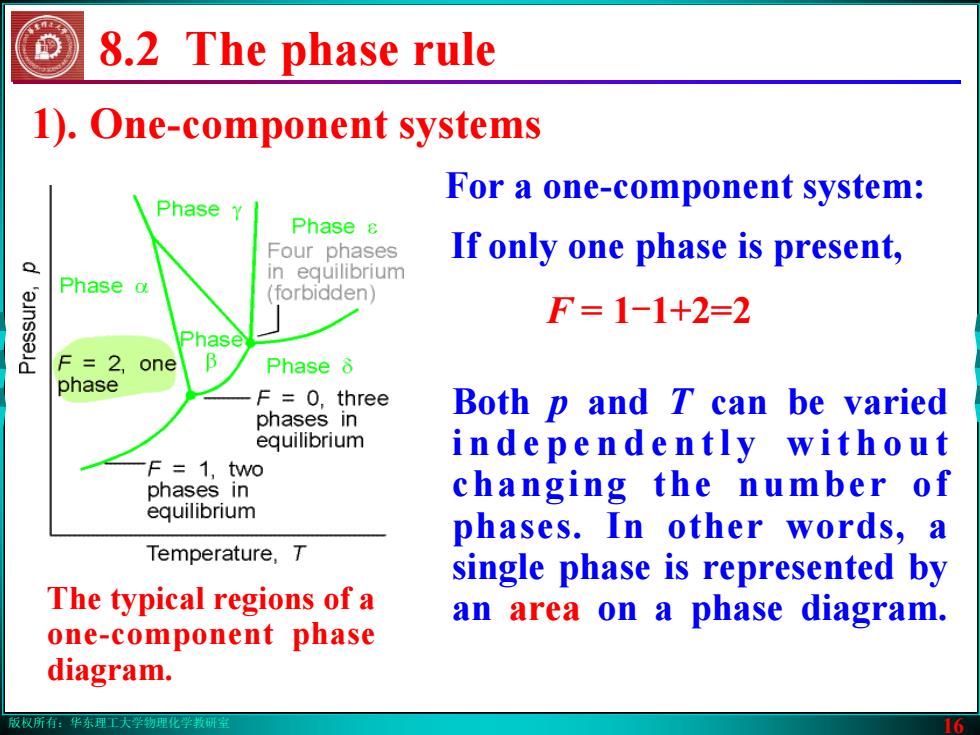
版权所有:华东理工大学物理化学教研室 16 1). One-component systems Both p and T can be varied i n d e p e n d e n t l y w i t h o u t changing the number of phases. In other words, a single phase is represented by an area on a phase diagram. 8.2 The phase rule The typical regions of a one-component phase diagram. If only one phase is present, F = 1-1+2=2 For a one-component system:
版权所有:华东理工大学物理化学教研室 16 1). One-component systems Both p and T can be varied i n d e p e n d e n t l y w i t h o u t changing the number of phases. In other words, a single phase is represented by an area on a phase diagram. 8.2 The phase rule The typical regions of a one-component phase diagram. If only one phase is present, F = 1-1+2=2 For a one-component system:
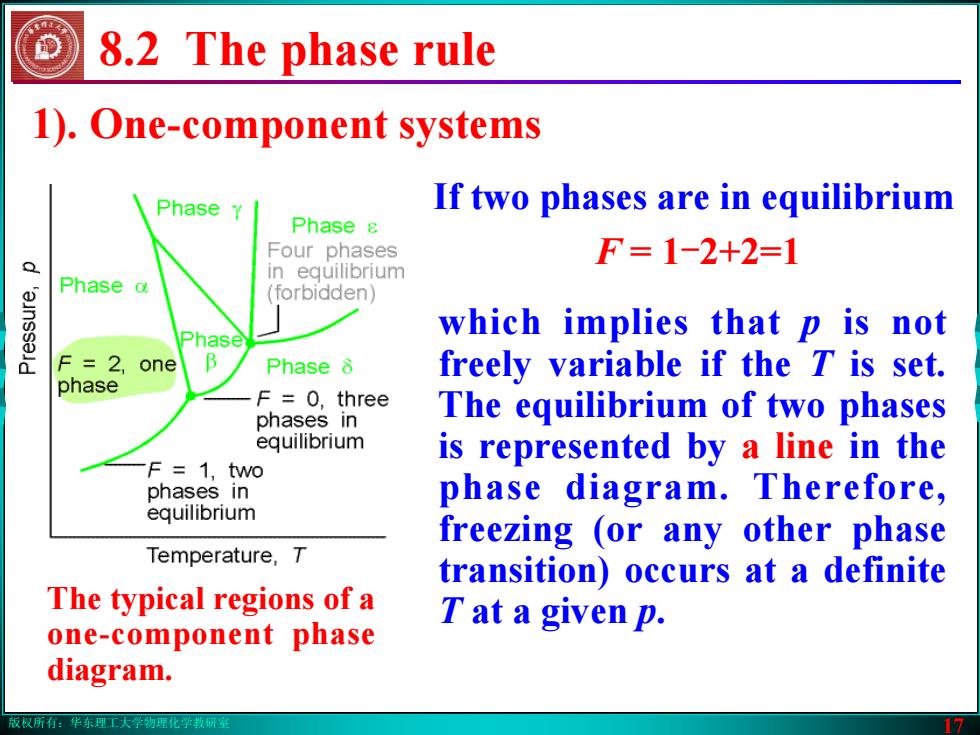
版权所有:华东理工大学物理化学教研室 17 1). One-component systems 8.2 The phase rule which implies that p is not freely variable if the T is set. The equilibrium of two phases is represented by a line in the phase diagram. Therefore, freezing (or any other phase transition) occurs at a definite T at a given p. If two phases are in equilibrium F = 1-2+2=1 The typical regions of a one-component phase diagram
版权所有:华东理工大学物理化学教研室 17 1). One-component systems 8.2 The phase rule which implies that p is not freely variable if the T is set. The equilibrium of two phases is represented by a line in the phase diagram. Therefore, freezing (or any other phase transition) occurs at a definite T at a given p. If two phases are in equilibrium F = 1-2+2=1 The typical regions of a one-component phase diagram
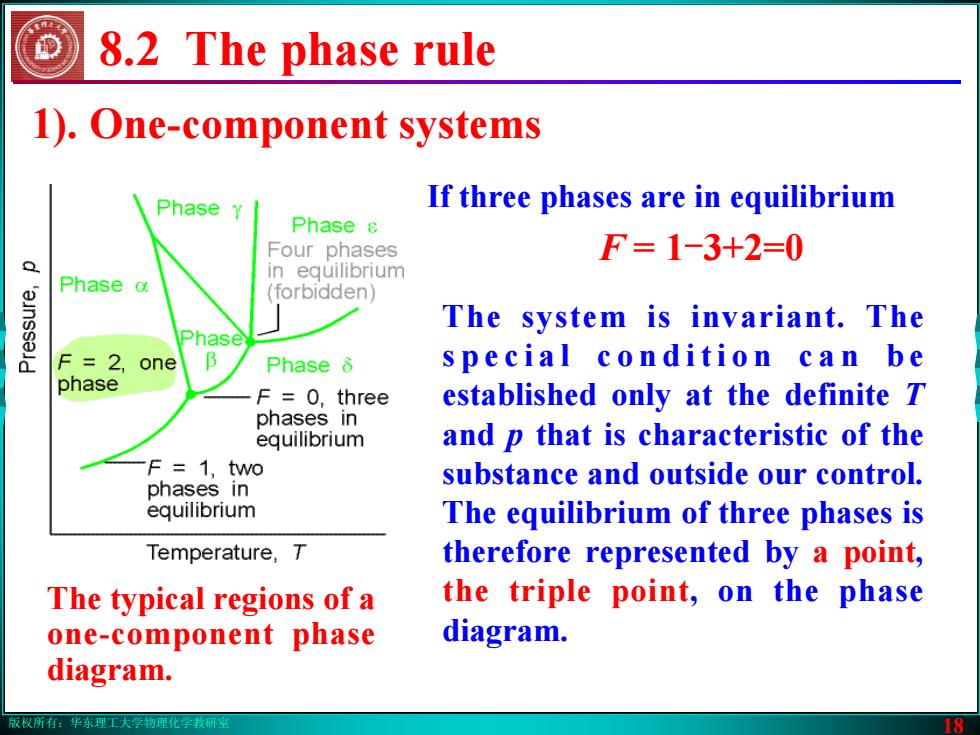
版权所有:华东理工大学物理化学教研室 18 8.2 The phase rule The system is invariant. The s p e c i a l c o n d i t i o n c a n b e established only at the definite T and p that is characteristic of the substance and outside our control. The equilibrium of three phases is therefore represented by a point, the triple point, on the phase diagram. If three phases are in equilibrium F = 1-3+2=0 1). One-component systems The typical regions of a one-component phase diagram
版权所有:华东理工大学物理化学教研室 18 8.2 The phase rule The system is invariant. The s p e c i a l c o n d i t i o n c a n b e established only at the definite T and p that is characteristic of the substance and outside our control. The equilibrium of three phases is therefore represented by a point, the triple point, on the phase diagram. If three phases are in equilibrium F = 1-3+2=0 1). One-component systems The typical regions of a one-component phase diagram
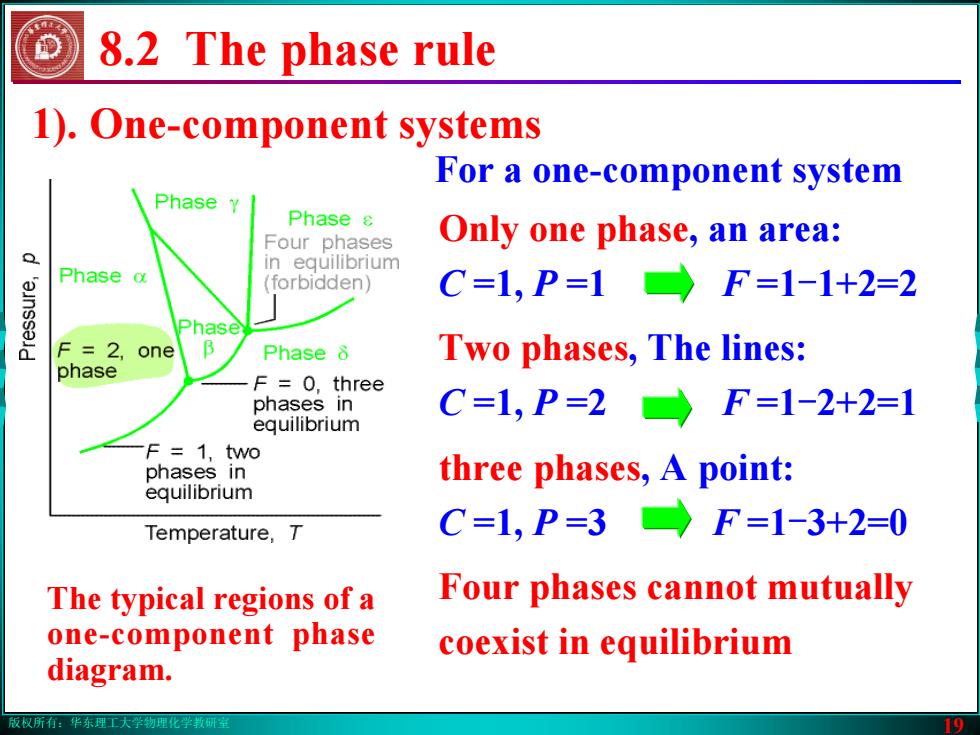
版权所有:华东理工大学物理化学教研室 19 8.2 The phase rule 1). One-component systems For a one-component system Only one phase, an area: C =1, P =1 F =1-1+2=2 Two phases, The lines: C =1, P =2 F =1-2+2=1 three phases, A point: C =1, P =3 F =1-3+2=0 Four phases cannot mutually coexist in equilibrium The typical regions of a one-component phase diagram
版权所有:华东理工大学物理化学教研室 19 8.2 The phase rule 1). One-component systems For a one-component system Only one phase, an area: C =1, P =1 F =1-1+2=2 Two phases, The lines: C =1, P =2 F =1-2+2=1 three phases, A point: C =1, P =3 F =1-3+2=0 Four phases cannot mutually coexist in equilibrium The typical regions of a one-component phase diagram
版权所有:华东理工大学物理化学教研室 20 Phases, components, and degrees of freedom 8.1 Definitions 8.2 The phase rule Two-component systems 8.3 Vapour pressure diagrams 8.4 Temperature-composition diagrams 8.5 Liquid-liquid phase diagrams 8.6 Liquid-solid phase diagrams 8.7 Ultrapurity and controlled impurity 8. Phase diagrams
版权所有:华东理工大学物理化学教研室 20 Phases, components, and degrees of freedom 8.1 Definitions 8.2 The phase rule Two-component systems 8.3 Vapour pressure diagrams 8.4 Temperature-composition diagrams 8.5 Liquid-liquid phase diagrams 8.6 Liquid-solid phase diagrams 8.7 Ultrapurity and controlled impurity 8. Phase diagrams