2 Exercise:compute graph MPL L Y MPL a. Determine MPL at each value of L 0 n.a. 10 ? b.Graph the production function 23 97 ? 8 c. Graph the MPL curve ? with MPL on the 5 ? vertical axis and L on the horizontal axis 67 405925 ? 8 10 CHAPTER 3 National Income slide 11
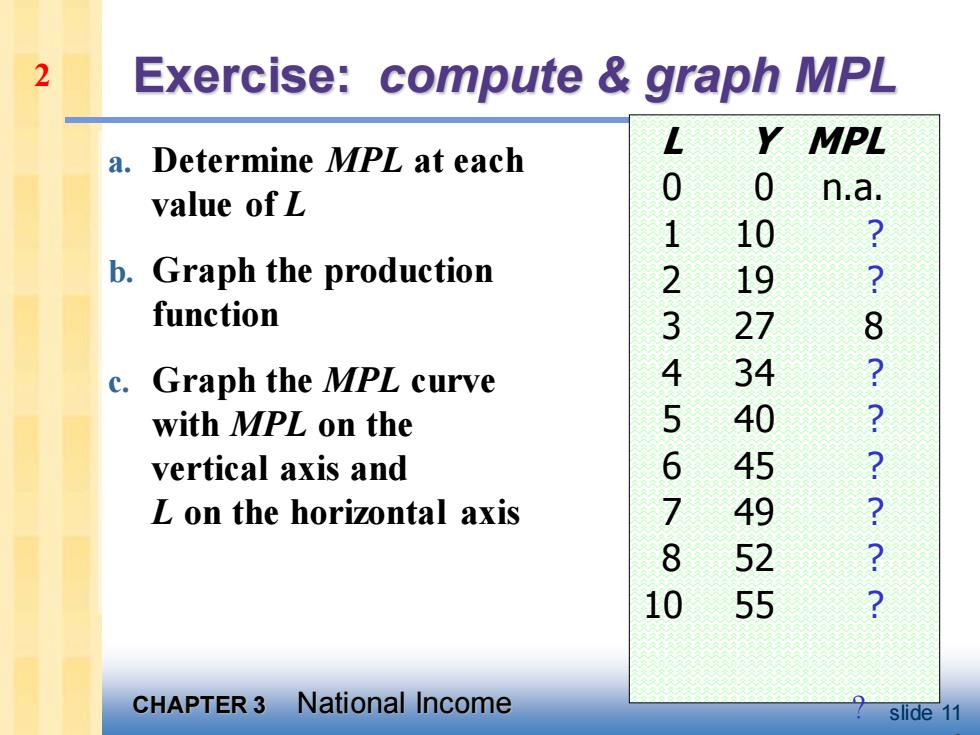
CHAPTER 3 National Income slide 11 Exercise: compute & graph MPL a. Determine MPL at each value of L b. Graph the production function c. Graph the MPL curve with MPL on the vertical axis and L on the horizontal axis L Y MPL 0 0 n.a. 1 10 ? 2 19 ? 3 27 8 4 34 ? 5 40 ? 6 45 ? 7 49 ? 8 52 ? 10 55 ? 2 ? 9
2 answers: Production function Marginal Product of Labor E 60 (andino jo 2 10 40 6 20 4 00 2 0 012345678910 012345678910 Labor(L) Labor (L) CHAPTER 3 National Income slide 12
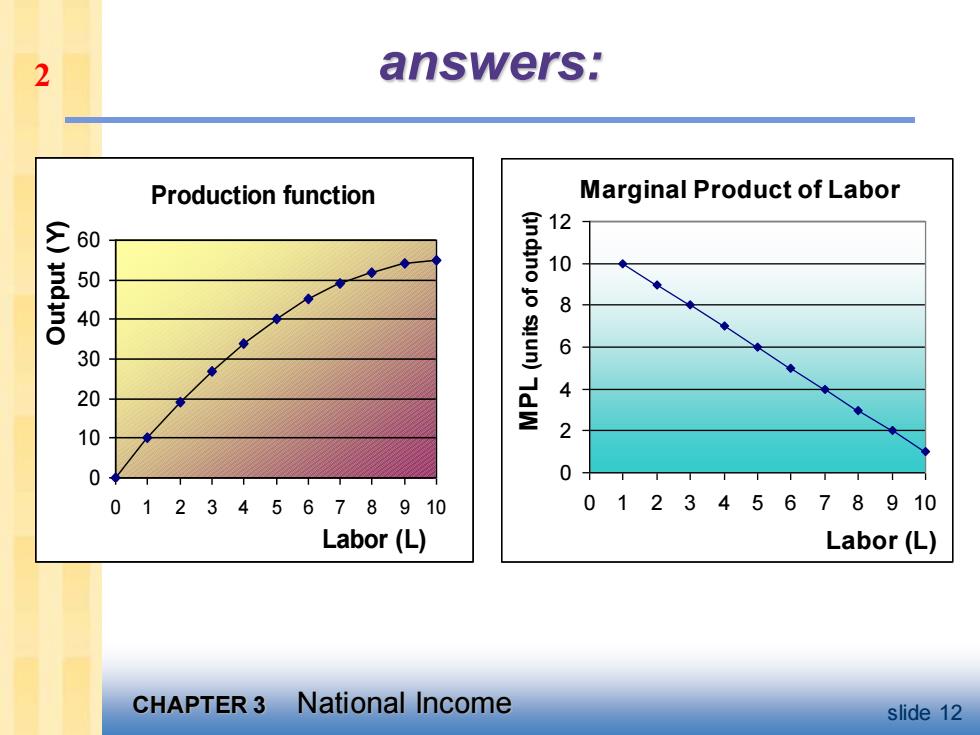
CHAPTER 3 National Income slide 12 answers: Production function 0 10 20 30 40 50 60 0 1 2 3 4 5 6 7 8 9 10 Labor (L) Output (Y) Marginal Product of Labor 0 2 4 6 8 10 12 0 1 2 3 4 5 6 7 8 9 10 Labor (L) MPL (units of output) 2
The MPL and the production function Y output F(K,L MPL 1 As more labor is MPL added,MPL↓ 1 MPL Slope of the production function equals MPL L labor CHAPTER 3 National Income slide 13
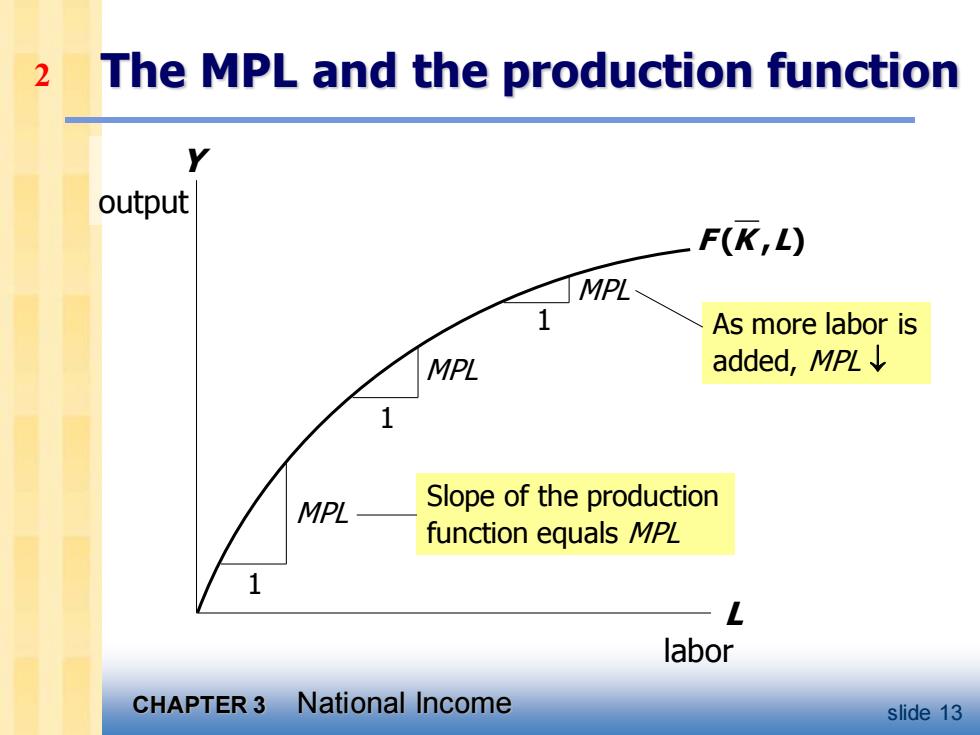
CHAPTER 3 National Income slide 13 Y output The MPL and the production function L labor F K L ( , ) 1 MPL 1 MPL 1 MPL As more labor is added, MPL Slope of the production function equals MPL 2
2 Diminishing marginal returns As a factor input is increased,its marginal product falls (other things equal). Intuition: TL while holding K fixed fewer machines per worker →lower productivity CHAPTER 3 National Income slide 14
CHAPTER 3 National Income slide 14 Diminishing marginal returns ▪ As a factor input is increased, its marginal product falls (other things equal). ▪ Intuition: L while holding K fixed fewer machines per worker lower productivity 2
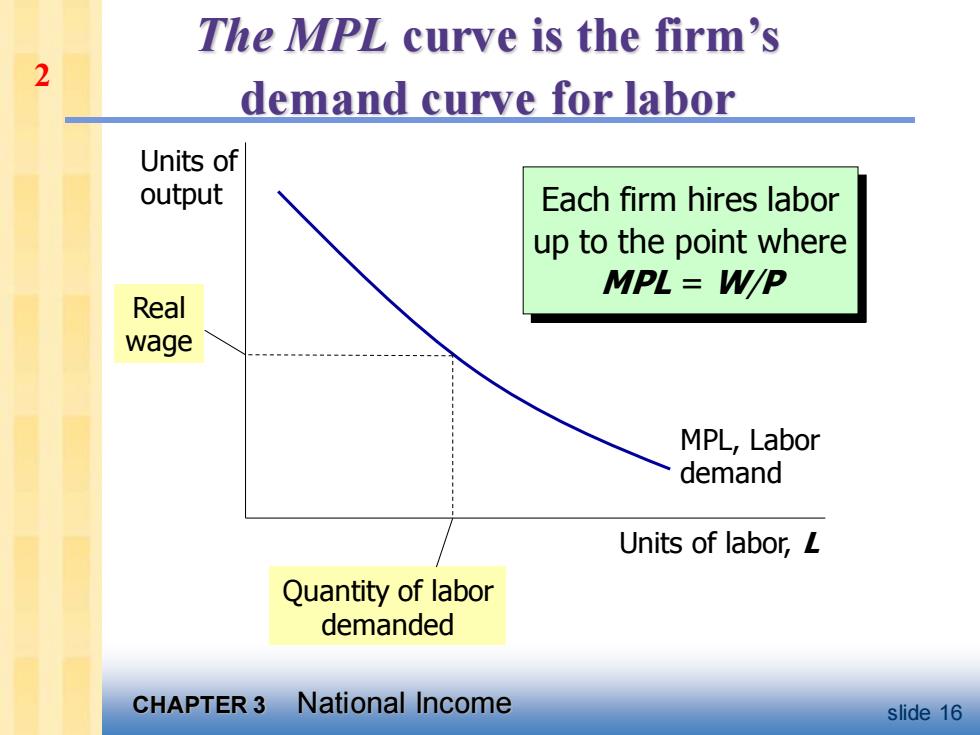
The MPL curve is the firm's 2 demand curve for labor Units of output Each firm hires labor up to the point where MPL=W/P Real wage MPL,Labor demand Units of labor,L Quantity of labor demanded CHAPTER 3 National Income slide 16
CHAPTER 3 National Income slide 16 The MPL curve is the firm’s demand curve for labor Each firm hires labor up to the point where MPL = W/P Units of output Units of labor, L MPL, Labor demand Real wage Quantity of labor demanded 2