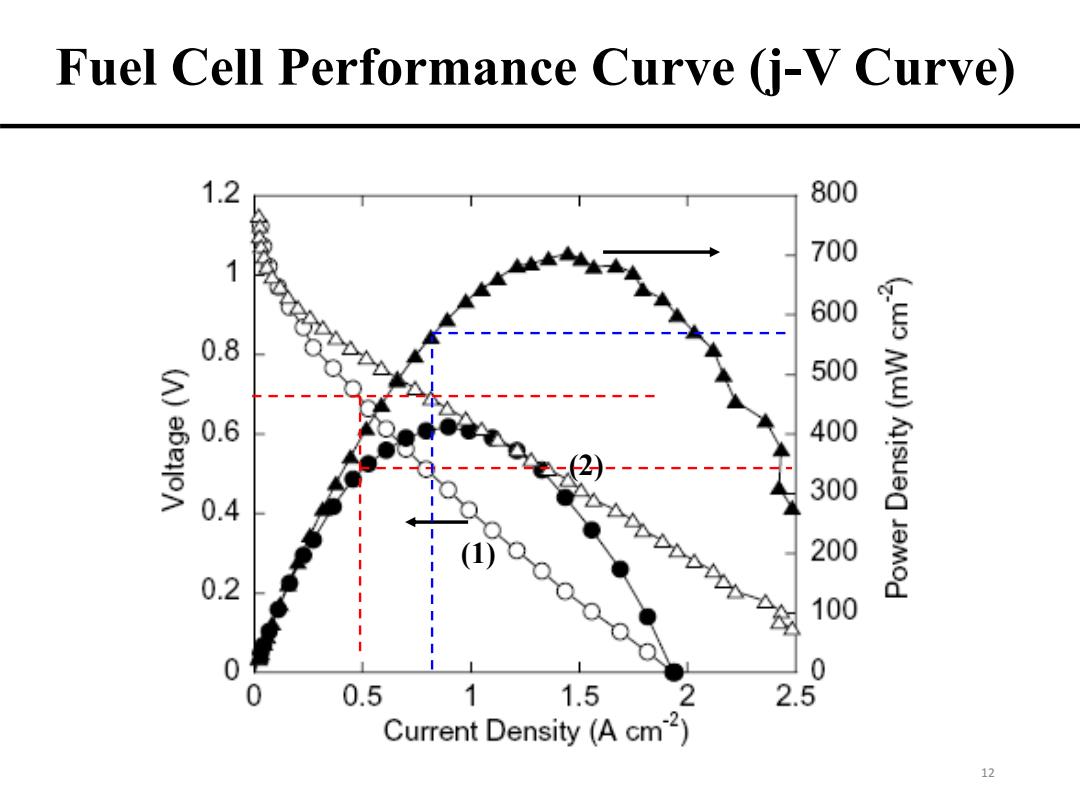
Fuel Cell Performance Curve (j-V Curve) 1.2 800 1 0.8 3 6eloA 0.6 0.4 0.2 0.5 1 1.5 2 2.5 Current Density(A cm2) 12
12 Fuel Cell Performance Curve (j-V Curve) (1) (2)
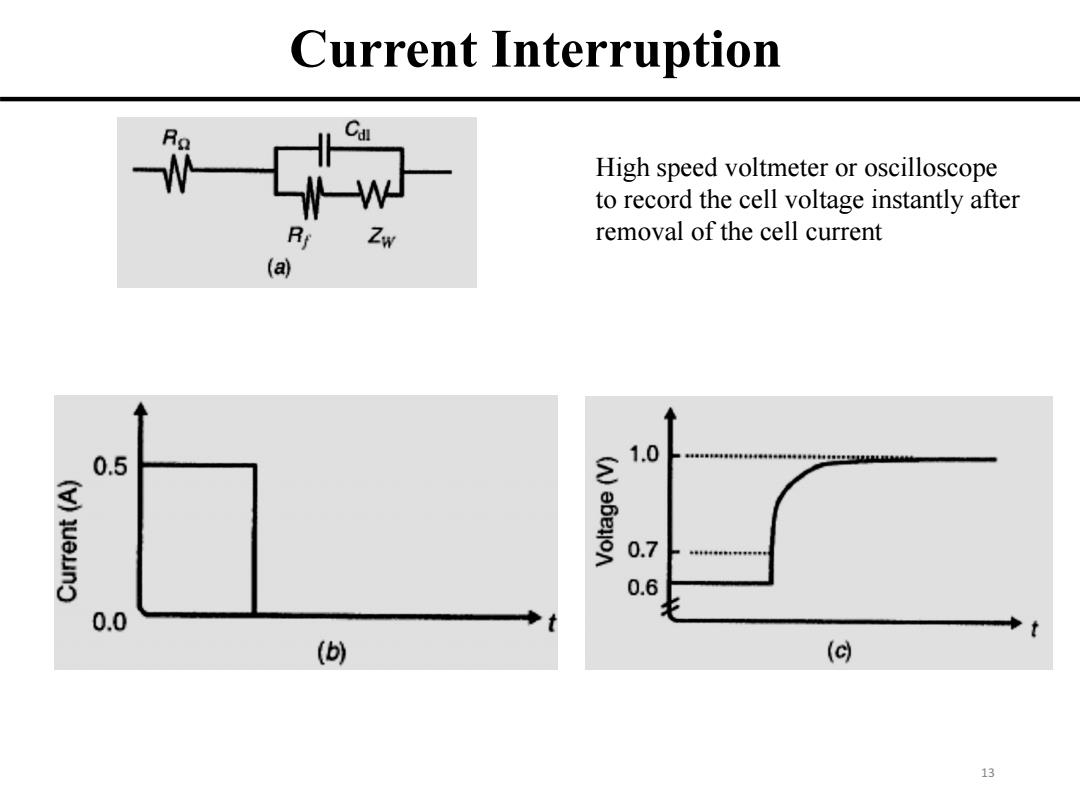
Current Interruption Ra High speed voltmeter or oscilloscope to record the cell voltage instantly after Zw removal of the cell current (a) 0.5 1.0 (v)queuno 0.7 0.6 0.0 () (c 13
13 Current Interruption High speed voltmeter or oscilloscope to record the cell voltage instantly after removal of the cell current

Electrochemical Impedace Spectroscopy (EIS) Voe jwr Z ioe=Zoe=Zo(cosjsin (A)a6eHon j=v1 2 (Z)wl- 0 (v)luauno 0 3 4 5 6 Real(Z) -Phase shift() Zmeasured R2 R Defining Relation Impedance Resistor W V=IxR ZR=R 1-ca业 1 o-W Capacitor dr Zc= joC C Inductor m v= ZL=joL C2 dt 14
14 Electrochemical Impedace Spectroscopy (EIS) Real (Z) j 1

Instrumentation for eIs of Fuel Cells Freq.Response Analyzer Small-signal voltage Gen. perturbation Probe pseudolinear IAC 八个 portion of i-V curve Potentiostat 3 ebeliOn lIe Voltage lead Current (A) Yields small- Current lead Fuel signal current response Cell 1-20mV AC,typically 10mV AC 15
15 Instrumentation for EIS of Fuel Cells Voltage lead Current lead Potentiostat 1-20mV AC, typically 10mV AC
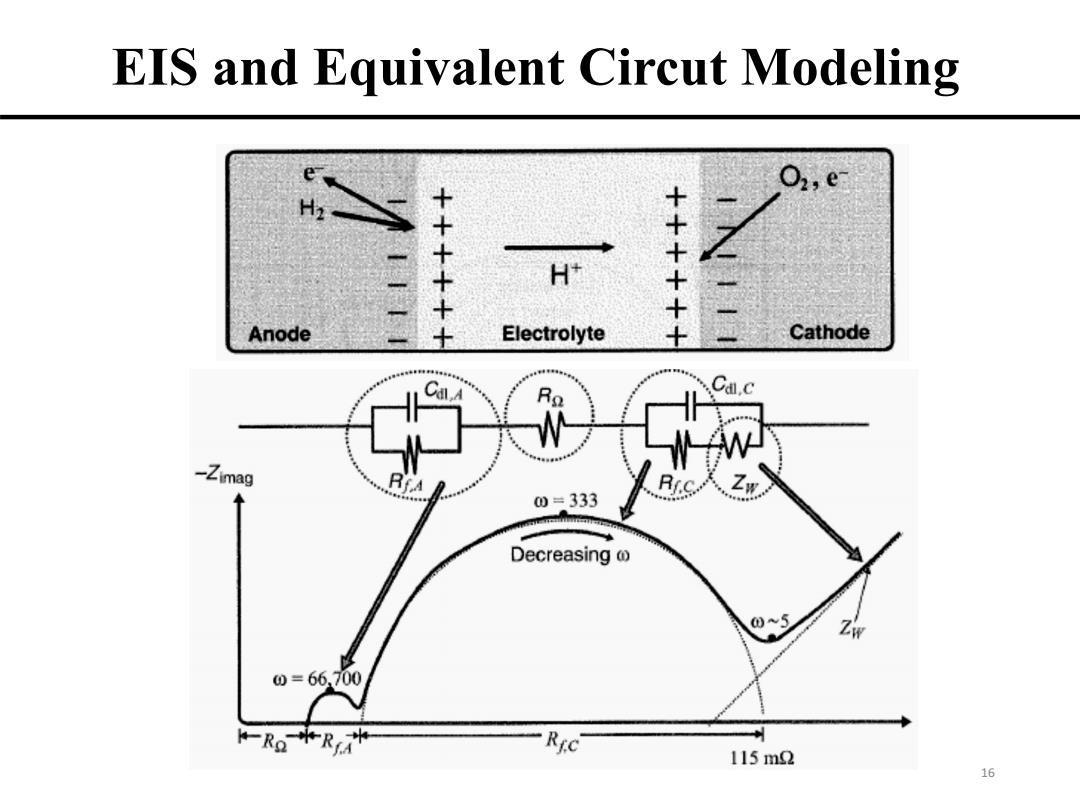
EIS and Equivalent Circut Modeling 02,e 二一 H +++ Anode Electrolyte ++ Cathode Ca.c -Zimag 00=333 Decreasing 05 Zw 0=66,700 RaR光 Ric 115m2 16
16 EIS and Equivalent Circut Modeling