先进材料疑固实验室 Solute partition ratio Laboratory of Advanced Materials Solidification When a piece of alloy solid is growing with a plane front from an alloy liquid with an overall alloy composition,Co,the solute concentration in the liquid at the solid/liquid interface is C*,and the solute concentration in the solid at the solid/liquid interface is Cs*. The temperature at the solid/liquid interface is T* Co Cs" C* 上浒充通大学 SHANGHAI JIAO TONG UNIVERSITY
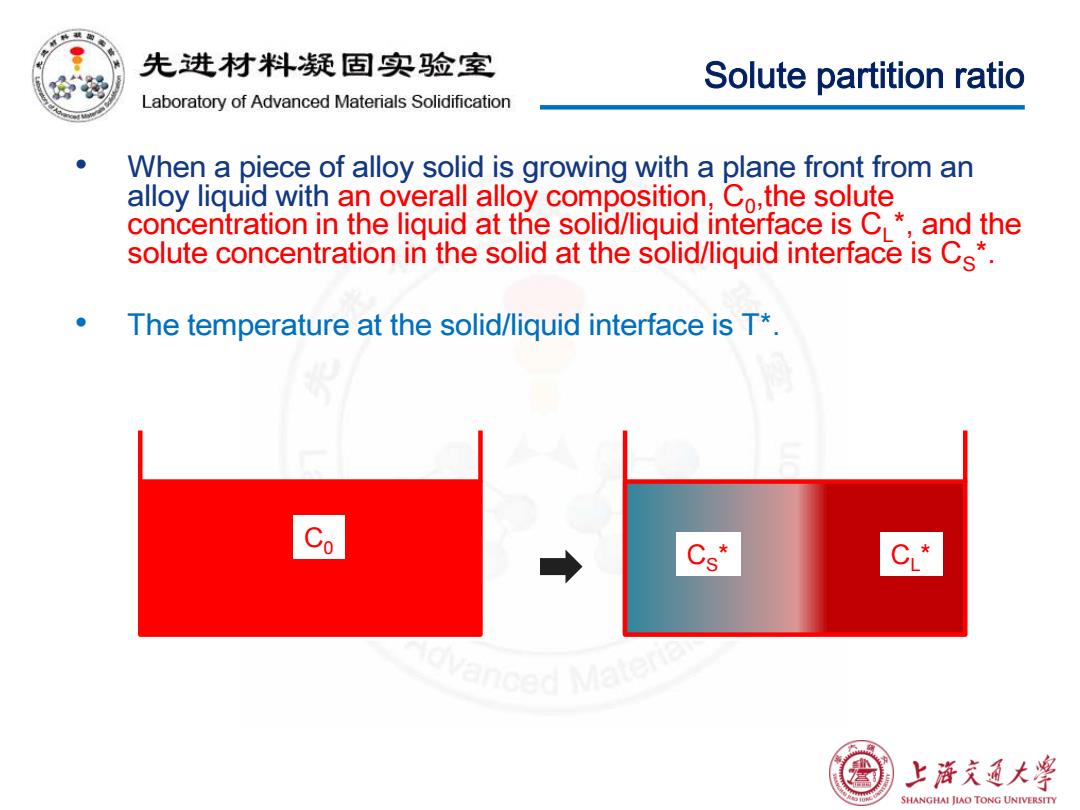
Solute partition ratio • When a piece of alloy solid is growing with a plane front from an alloy liquid with an overall alloy composition, C0,the solute concentration in the liquid at the solid/liquid interface is CL*, and the solute concentration in the solid at the solid/liquid interface is CS*. • The temperature at the solid/liquid interface is T*. C0 CL C * S *
先进材料疑固实验室 Solute distribution coefficient Laboratory of Advanced Materials Solidification During crystal growth,the solid and Co liguid at the interface are in c誉 thermodynamic equilibrium,so C and ↑ cL Cs*are defined by the phase diagram. LIQUID In most cases:CL*and Cs*are not equal.The ratio between Cs*and CL*,k, is called the equilibrium solute distribution coefficient: COMPOSITION- (o) k= Cs Also call as solute partition ratio ced Matenak 上浒充通大学 SHANGHAI JIAO TONG UNIVERSITY
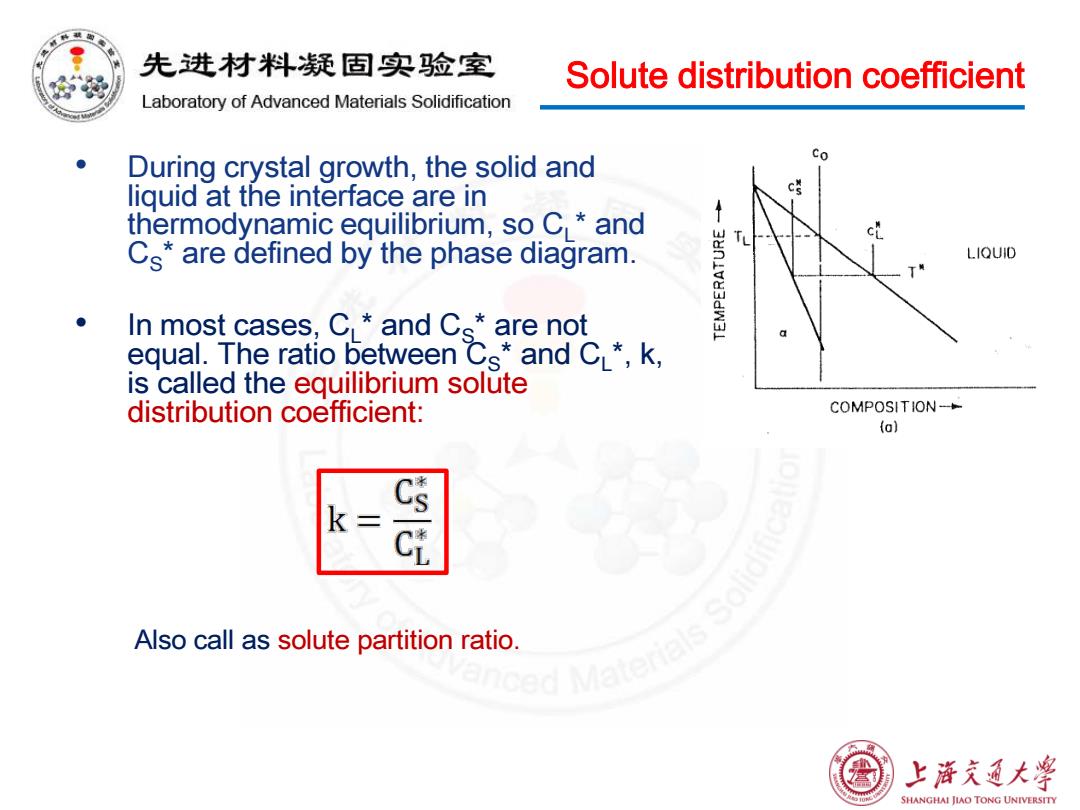
Solute distribution coefficient • During crystal growth, the solid and liquid at the interface are in thermodynamic equilibrium, so CL* and CS* are defined by the phase diagram. • In most cases, CL* and CS* are not equal. The ratio between CS* and CL*, k, is called the equilibrium solute distribution coefficient: Also call as solute partition ratio
先进材料疑固实验室 Solute distribution coefficient Laboratory of Advanced Materials Solidification In many cases the liquidus and solidus lines go downward,and k<1.In most calculation case,we focus on k<1. In some cases,the liquidus and solidus lines go upward,and k>1. vanced Materials Solid 上浒充通大学 SHANGHAI JIAO TONG UNIVERSITY
Solute distribution coefficient • In many cases the liquidus and solidus lines go downward, and k<1. In most calculation case, we focus on k<1. • In some cases, the liquidus and solidus lines go upward, and k>1
先进材料疑固实验室 Liquidus line slope,m Laboratory of Advanced Materials Solidification Generally,in order to simplify the mathematical treatment of solidification processes,it is assumed that liquidus and solidus lines of the phase diagram are straight. >Therefore,that the distribution T coefficient,k,and the liquidus slope, m=dT/dc △TO m,are constant. ACo liquidus solidus >m is defined so that the product, m(k-1),is positive. Co Co/k 上游文通大学 SHANGHAI JIAO TONG UNIVERSITY
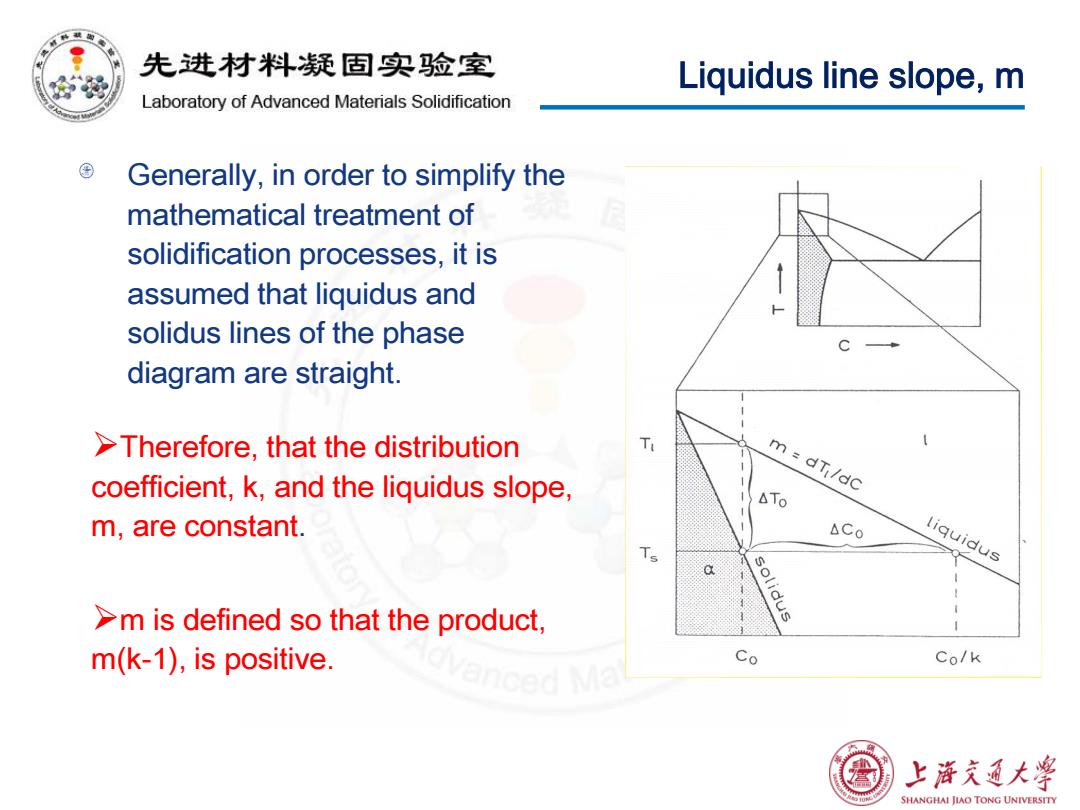
Liquidus line slope, m Generally, in order to simplify the mathematical treatment of solidification processes, it is assumed that liquidus and solidus lines of the phase diagram are straight. Therefore, that the distribution coefficient, k, and the liquidus slope, m, are constant. m is defined so that the product, m(k-1), is positive
先进材料疑固实验室 Equilibrium state Laboratory of Advanced Materials Solidification Definition of equilibrium state The real solidification is never equilibrium.But in most case,to simplify mathematical calculation,it is assumed that there is a local equilibrium can be achieved at S/L interface. This assumption can be used in liquid metal solidification in conventional casting and welding. This assumption means it is able to figure out the solid and liquid composition at the interface use equilibrium phase diagram. But this doesn't means the system is equilibrium because in the system there are temperature and composition gradient. 上浒充通大学 SHANGHAI JIAO TONG UNIVERSITY
Equilibrium state Definition of equilibrium state • The real solidification is never equilibrium. But in most case, to simplify mathematical calculation, it is assumed that there is a local equilibrium can be achieved at S/L interface. • This assumption can be used in liquid metal solidification in conventional casting and welding. • This assumption means it is able to figure out the solid and liquid composition at the interface use equilibrium phase diagram. • But this doesn’t means the system is equilibrium because in the system there are temperature and composition gradient