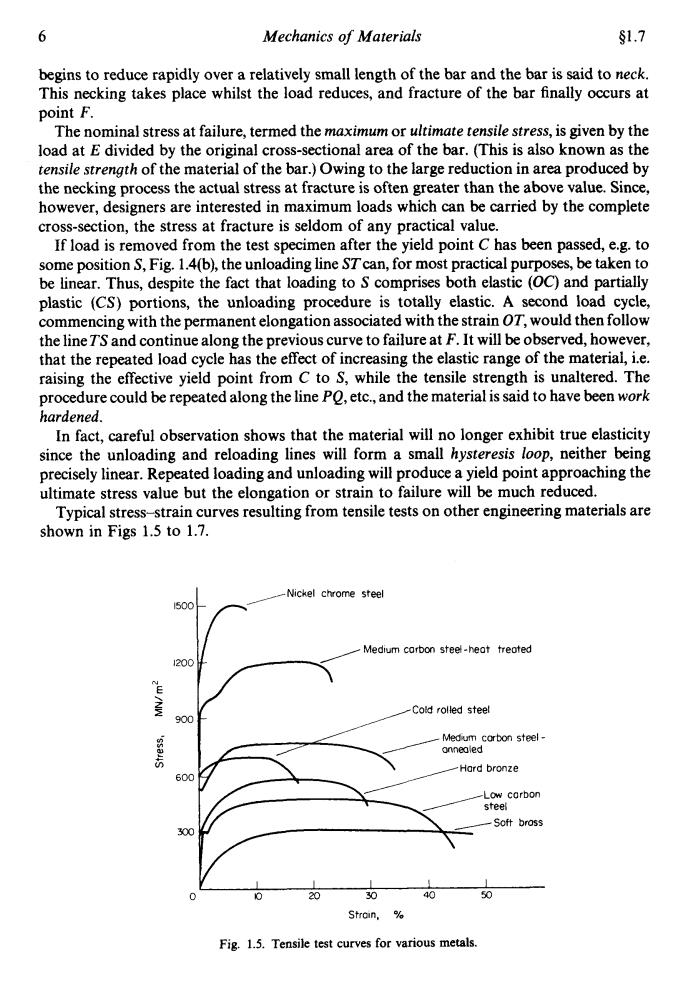
6 Mechanics of Materials $1.7 begins to reduce rapidly over a relatively small length of the bar and the bar is said to neck. This necking takes place whilst the load reduces,and fracture of the bar finally occurs at point F. The nominal stress at failure,termed the maximum or ultimate tensile stress,is given by the load at E divided by the original cross-sectional area of the bar.(This is also known as the tensile strength of the material of the bar.)Owing to the large reduction in area produced by the necking process the actual stress at fracture is often greater than the above value.Since, however,designers are interested in maximum loads which can be carried by the complete cross-section,the stress at fracture is seldom of any practical value. If load is removed from the test specimen after the yield point C has been passed,e.g.to some position S,Fig.1.4(b),the unloading line STcan,for most practical purposes,be taken to be linear.Thus,despite the fact that loading to S comprises both elastic (OC)and partially plastic (CS)portions,the unloading procedure is totally elastic.A second load cycle, commencing with the permanent elongation associated with the strain OT,would then follow the lineT'S and continue along the previous curve to failure at F.It will be observed,however, that the repeated load cycle has the effect of increasing the elastic range of the material,i.e. raising the effective yield point from C to S,while the tensile strength is unaltered.The procedure could be repeated along the line Po,etc.,and the material is said to have been work hardened. In fact,careful observation shows that the material will no longer exhibit true elasticity since the unloading and reloading lines will form a small hysteresis loop,neither being precisely linear.Repeated loading and unloading will produce a yield point approaching the ultimate stress value but the elongation or strain to failure will be much reduced. Typical stress-strain curves resulting from tensile tests on other engineering materials are shown in Figs 1.5 to 1.7. Nickel chrome steel 1500 Medium carbon steel-heat treoted 1200 Cold rolled steel 900 Medum corbon steel- onnealed Hard bronze -Low corbon steel Soft bross 00 20 30 40 50 Stroin, Fig.1.5.Tensile test curves for various metals
6 Mechanics of Materials 01.7 begins to reduce rapidly over a relatively small length of the bar and the bar is said to neck. This necking takes place whilst the load reduces, and fracture of the bar finally occurs at point F. The nominal stress at failure, termed the maximum or ultimate tensile stress, is given by the load at E divided by the original cross-sectional area of the bar. (This is also known as the tensile strength of the material of the bar.) Owing to the large reduction in area produced by the necking process the actual stress at fracture is often greater than the above value. Since, however, designers are interested in maximum loads which can be carried by the complete cross-section, the stress at fracture is seldom of any practical value. If load is removed from the test specimen after the yield point C has been passed, e.g. to some position S, Fig. 1.4(b), the unloading line STcan, for most practical purposes, be taken to be linear. Thus, despite the fact that loading to S comprises both elastic (OC) and partially plastic (CS) portions, the unloading procedure is totally elastic. A second load cycle, commencing with the permanent elongation associated with the strain OT, would then follow the line TS and continue along the previous curve to failure at F. It will be observed, however, that the repeated load cycle has the effect of increasing the elastic range of the material, i.e. raising the effective yield point from C to S, while the tensile strength is unaltered. The procedure could be repeated along the line PQ, etc., and the material is said to have been work hardened. In fact, careful observation shows that the material will no longer exhibit true elasticity since the unloading and reloading lines will form a small hysteresis loop, neither being precisely linear. Repeated loading and unloading will produce a yield point approaching the ultimate stress value but the elongation or strain to failure will be much reduced. Typical stress-strain curves resulting from tensile tests on other engineering materials are shown in Figs 1.5 to 1.7. 1500tr /Nickel chrome steel u- Medium carbon steel - &i ?! 600 Y I I I I I 0 0 20 30 40 50 Strain. % Fig. 1.5. Tensile test curves for various metals
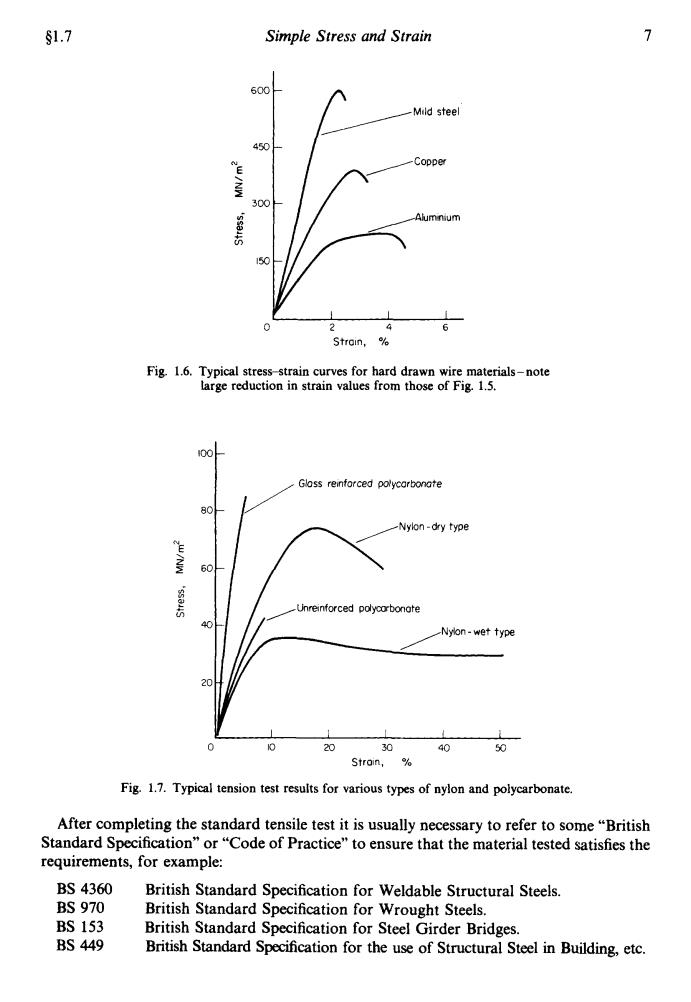
$1.7 Simple Stress and Strain 7 600 Mild steel 450 E Copper 300 Alumnium 150 2 6 Strain, Fig.1.6.Typical stress-strain curves for hard drawn wire materials-note large reduction in strain values from those of Fig.1.5. 00 Gloss reinforced polycarbonate -Nylon-dry type 60 Unreinforced polycorbonate 40 Nyion-wet type 20 20 30 40 50 Stroin, Fig.1.7.Typical tension test results for various types of nylon and polycarbonate. After completing the standard tensile test it is usually necessary to refer to some"British Standard Specification"or"Code of Practice"to ensure that the material tested satisfies the requirements,for example: BS4360 British Standard Specification for Weldable Structural Steels BS970 British Standard Specification for Wrought Steels. BS153 British Standard Specification for Steel Girder Bridges. BS449 British Standard Specification for the use of Structural Steel in Building,etc
$1.7 Simple Stress and Strain 7 Strain, % Fig. 1.6. Typical stressstrain curves for hard drawn wire material-note large reduction in strain values from those of Fig. 1.5. Glass remforced polycarbonate eo ? ’ I I / ,Unreinforced pdycnrbonote c, Y I I I I I 0 10 20 30 40 50 Strain, % Fig. 1.7. Typical tension test results for various types of nylon and polycarbonate. After completing the standard tensile test it is usually necessary to refer to some “British Standard Specification” or “Code of Practice” to ensure that the material tested satisfies the requirements, for example: BS 4360 BS 970 BS 153 BS 449 British Standard Specification for Weldable Structural Steels. British Standard Specification for Wrought Steels. British Standard Specification for Steel Girder Bridges. British Standard Specification for the use of Structural Steel in Building, etc
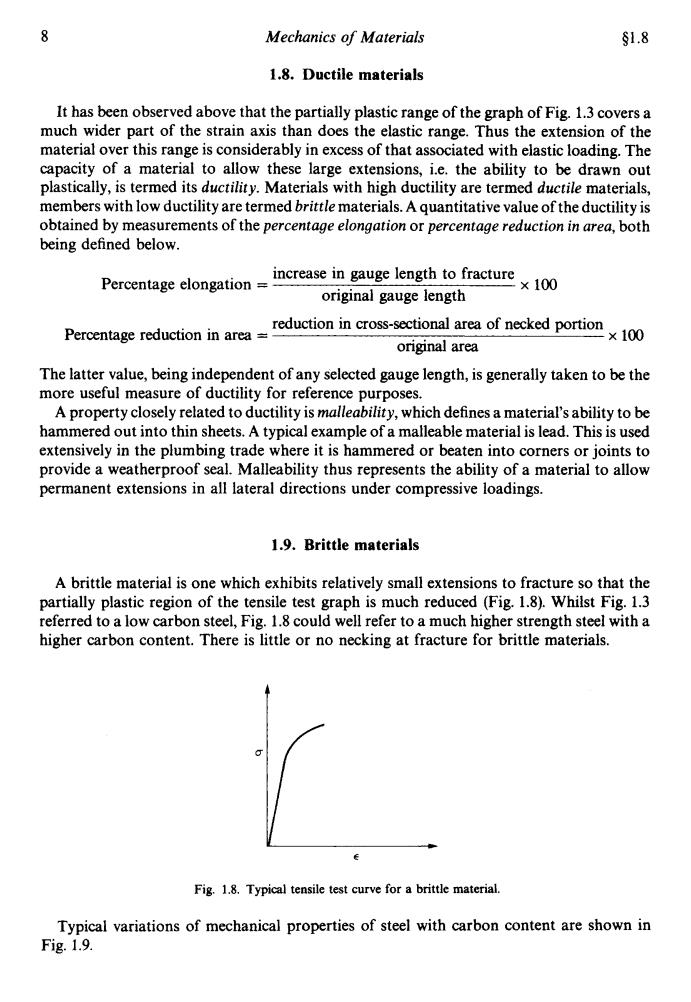
8 Mechanics of Materials §1.8 1.8.Ductile materials It has been observed above that the partially plastic range of the graph of Fig.1.3 covers a much wider part of the strain axis than does the elastic range.Thus the extension of the material over this range is considerably in excess of that associated with elastic loading.The capacity of a material to allow these large extensions,i.e.the ability to be drawn out plastically,is termed its ductility.Materials with high ductility are termed ductile materials, members with low ductility are termed brittle materials.A quantitative value of the ductility is obtained by measurements of the percentage elongation or percentage reduction in area,both being defined below. Percentage elongation=increase in gauge length to fracture ×100 original gauge length Perntage reduction indctinn rosciorea f ecked portio -×100 original area The latter value,being independent of any selected gauge length,is generally taken to be the more useful measure of ductility for reference purposes. A property closely related to ductility is malleability,which defines a material's ability to be hammered out into thin sheets.A typical example of a malleable material is lead.This is used extensively in the plumbing trade where it is hammered or beaten into corners or joints to provide a weatherproof seal.Malleability thus represents the ability of a material to allow permanent extensions in all lateral directions under compressive loadings. 1.9.Brittle materials A brittle material is one which exhibits relatively small extensions to fracture so that the partially plastic region of the tensile test graph is much reduced(Fig.1.8).Whilst Fig.1.3 referred to a low carbon steel,Fig.1.8 could well refer to a much higher strength steel with a higher carbon content.There is little or no necking at fracture for brittle materials. Fig.1.8.Typical tensile test curve for a brittle material. Typical variations of mechanical properties of steel with carbon content are shown in Fig.1.9
8 Mechanics of Materials 51.8 1.8. Ductile materials It has been observed above that the partially plastic range of the graph of Fig. 1.3 covers a much wider part of the strain axis than does the elastic range. Thus the extension of the material over this range is considerably in excess of that associated with elastic loading. The capacity of a material to allow these large extensions, i.e. the ability to be drawn out plastically, is termed its ductility. Materials with high ductility are termed ductile materials, members with low ductility are termed brittle materials. A quantitative value of the ductility is obtained by measurements of the percentage elongation or percentage reduction in area, both being defined below. increase in gauge length to fracture original gauge length Percentage elongation = x loo reduction in cross-sectional area of necked portion original area Percentage reduction in area = x 100 The latter value, being independent of any selected gauge length, is generally taken to be the more useful measure of ductility for reference purposes. A property closely related to ductility is malleability, which defines a material's ability to be hammered out into thin sheets. A typical example of a malleable material is lead. This is used extensively in the plumbing trade where it is hammered or beaten into corners or joints to provide a weatherproof seal. Malleability thus represents the ability of a material to allow permanent extensions in all lateral directions under compressive loadings. 1.9. Brittle materials A brittle material is one which exhibits relatively small extensions to fracture so that the partially plastic region of the tensile test graph is much reduced (Fig. 1.8). Whilst Fig. 1.3 referred to a low carbon steel, Fig. 1.8 could well refer to a much higher strength steel with a higher carbon content. There is little or no necking at fracture for brittle materials. E Fig. 1.8. Typical tensile test curve for a brittle material. Typical variations of mechanical properties of steel with carbon content are shown in Fig. 1.9
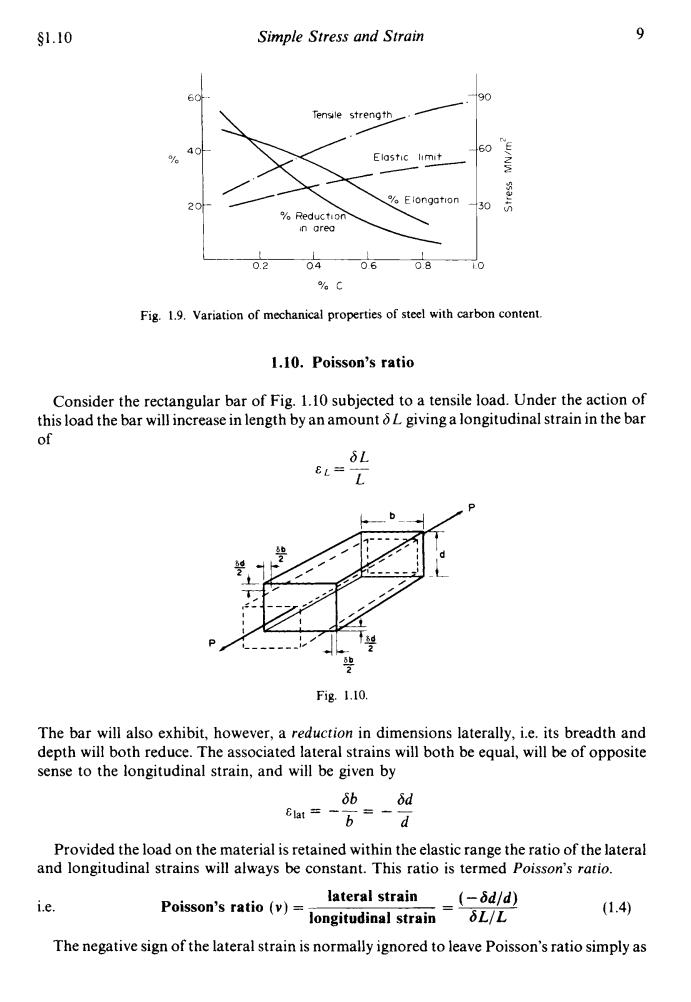
§1.10 Simple Stress and Strain 9 190 Tensile strength 60 Elostic limit 20 Elongotion 30 Reduction in orea 0.2 04 060.8 C Fig.1.9.Variation of mechanical properties of steel with carbon content. 1.10.Poisson's ratio Consider the rectangular bar of Fig.1.10 subjected to a tensile load.Under the action of this load the bar will increase in length by an amount oL giving a longitudinal strain in the bar of L= L Fig.1.10. The bar will also exhibit,however,a reduction in dimensions laterally,i.e.its breadth and depth will both reduce.The associated lateral strains will both be equal,will be of opposite sense to the longitudinal strain,and will be given by 6bδd 8at=-6=-d Provided the load on the material is retained within the elastic range the ratio of the lateral and longitudinal strains will always be constant.This ratio is termed Poisson's ratio. i.e. Poisson's ratio(v)=】 lateral strain (-6d/d) longitudinal strainL/L (1.4) The negative sign of the lateral strain is normally ignored to leave Poisson's ratio simply as
$1.10 Simple Stress and Strain 9 i90 I I I 02 04 06 08 10 Yo c Fig. 1.9. Variation of mechanical properties of steel with carbon content. 1.10. Poisson’s ratio Consider the rectangular bar of Fig. 1.10 subjected to a tensile load. Under the action of this load the bar will increase in length by an amount 6 L giving a longitudinal strain in the bar of 6L EL= - L Fig. 1.10. The bar will also exhibit, however, a reduction in dimensions laterally, i.e. its breadth and depth will both reduce. The associated lateral strains will both be equal, will be of opposite sense to the longitudinal strain, and will be given by 6b 6d b d Provided the load on the material is retained within the elastic range the ratio of the lateral &l,t = -- - -- and longitudinal strains will always be constant. This ratio is termed Poisson’s ratio. lateral strain (-6d/d) (1.4) 1.e. Poisson’s ratio (v) = - longitudinal strain 6LIL The negative sign of the lateral strain is normally ignored to leave Poisson’s ratio simply as