1.1 A tax cut Because consumers save (1-MPC)of the tax cut,the LM initial boost in spending is smaller for AT than for an equal△G.and the IS curve shifts by -MPC AT TS> 1-MPC I51 .so the effects on r and Y are smaller for a AT than for an equal△G. CHAPTER 11 Aggregate Demand ll slide 5
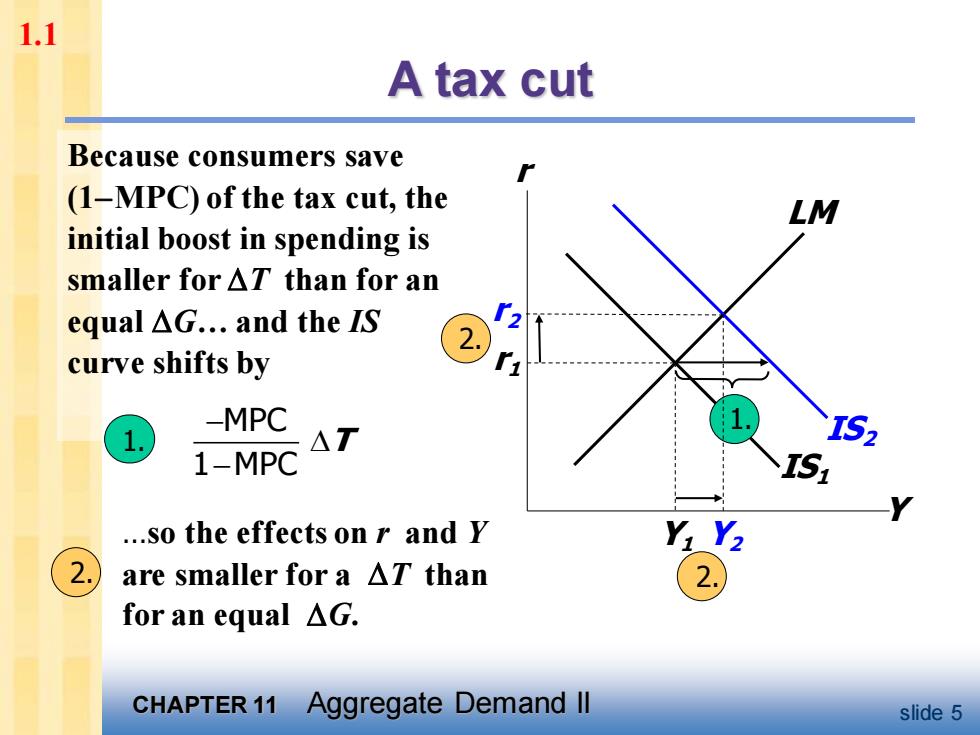
CHAPTER 11 Aggregate Demand II slide 5 IS1 1. A tax cut Y r LM r1 Y1 IS2 Y2 r2 Because consumers save (1−MPC) of the tax cut, the initial boost in spending is smaller for T than for an equal G. and the IS curve shifts by MPC 1 MPC T − − 1. 2. 2. .so the effects on r and Y are smaller for a T than for an equal G. 2. 1.1
1.1 Monetary Policy:an increase in M 1.△M>0 shifts LM1 the LM curve down (or to the right) LM2 2. .causing the interest rate to fall 3. .which increases investment,causing output income to Y Y2 rise. Return CHAPTER 11 Aggregate Demand ll slide 6
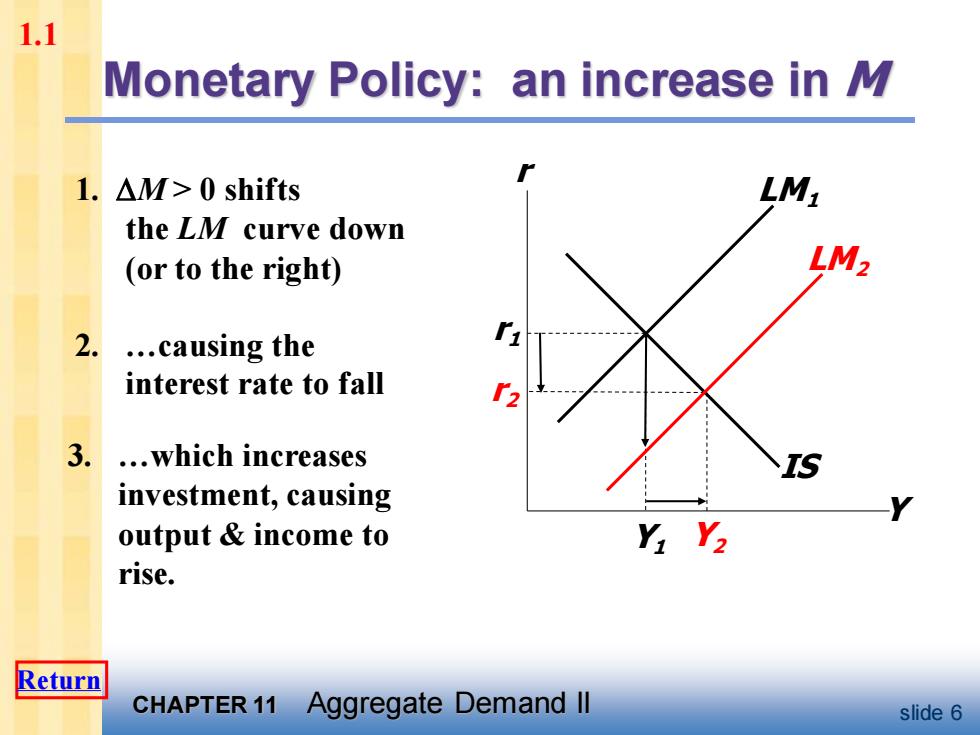
CHAPTER 11 Aggregate Demand II slide 6 2. .causing the interest rate to fall IS Monetary Policy: an increase in M 1. M > 0 shifts the LM curve down (or to the right) Y r LM1 r1 Y1 Y2 r2 LM2 3. .which increases investment, causing output & income to rise. 1.1 Return
1.2 Interaction between monetary fiscal policy ■Model:: Monetary fiscal policy variables (M,G and T)are exogenous ·Real world: Monetary policymakers may adjust M in response to changes in fiscal policy,or vice versa(反过来也是这样), Such interaction may alter the impact of the original policy change. CHAPTER 11 Aggregate Demand ll slide 7
CHAPTER 11 Aggregate Demand II slide 7 Interaction between monetary & fiscal policy ▪ Model: Monetary & fiscal policy variables (M, G and T ) are exogenous ▪ Real world: Monetary policymakers may adjust M in response to changes in fiscal policy, or vice versa (反过来也是这样). ▪ Such interaction may alter the impact of the original policy change. 1.2
1.2 The Fed's response to AG>0 Suppose Congress increases G. Possible Fed responses: 1.hold M constant 2.hold r constant 3.hold Y constant In each case,the effects of the AG are different: CHAPTER 11 Aggregate Demand ll slide 8
CHAPTER 11 Aggregate Demand II slide 8 The Fed’s response to G > 0 ▪ Suppose Congress increases G. ▪ Possible Fed responses: 1. hold M constant 2. hold r constant 3. hold Y constant ▪ In each case, the effects of the G are different: 1.2
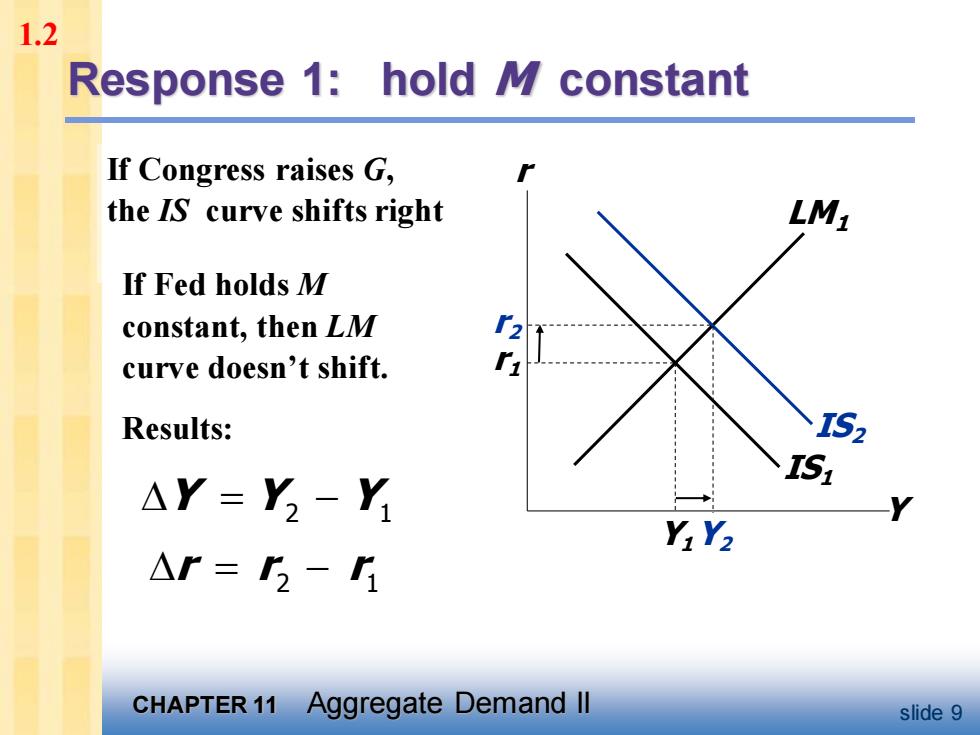
1.2 Response 1:hold M constant If Congress raises G, the IS curve shifts right LM1 If Fed holds M constant,then LM curve doesn't shift. Results: I52 I51 △Y=Y2-Y YY2 △r=- CHAPTER 11 Aggregate Demand ll slide 9
CHAPTER 11 Aggregate Demand II slide 9 If Congress raises G, the IS curve shifts right IS1 Response 1: hold M constant Y r LM1 r1 Y1 IS2 Y2 r2 If Fed holds M constant, then LM curve doesn’t shift. Results: = − Y Y Y 2 1 2 1 = − r r r 1.2