中国科学技术大学:《数理统计》课程教学资源(课件讲义)第五讲 点估计方法(二)极大似然估计方法
文件格式: PDF大小: 540.48KB页数: 12
中国科学技术大学:《数理统计》课程教学资源(课件讲义)第四讲 点估计方法(一)矩估计方法
文件格式: PDF大小: 505.93KB页数: 10
中国科学技术大学:《数理统计》课程教学资源(课件讲义)第三讲 指数族与充分完备统计量
文件格式: PDF大小: 532.13KB页数: 8
中国科学技术大学:《数理统计》课程教学资源(课件讲义)第二讲 统计量的分布(抽样分布)
文件格式: PDF大小: 453.03KB页数: 8

《数理统计》课程教学资源(参考资料)Hoeffding's Indequality 证明中的一个不等式的证明 complementary
文件格式: PDF大小: 140.1KB页数: 1
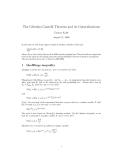
《数理统计》课程教学资源(参考资料)Glivenko-Cantelli 定理的证明
文件格式: PDF大小: 182.24KB页数: 6

江西农业大学学报:奶牛产奶量与乳成分的多元回归分析(宁夏大学:张巧娥、吴学荣、马水鱼、邢燕)
文件格式: PDF大小: 116.17KB页数: 5

中国科学院大学:《时间序列计量经济学中的非参数分析》课程教学资源(讲义材料)Introduction to Nonparametric Analysis in Time Series Econometrics
文件格式: PDF大小: 460.8KB页数: 99

02 非参数分析的重要性 03 什么是非参数分析 (Nonparametric Analysis) 04 全局平滑法 (Global Smoothing) 目录 01 导论 06 非参数方法与机器学习 07 结论 08 05 局部平滑法 (Local Smoothing)
文件格式: PDF大小: 3.72MB页数: 94
贵州医科大学:《医学统计学 Medical Statistics》课程教学资源(电子教案,打印版)12 寿命表及其应用
文件格式: PDF大小: 275.39KB页数: 1