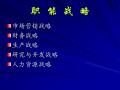

一、三种基本竞争战略 二、不同产业环境中的竞争战略 三、不同位次的竞争战略 四、不同规模企业的竞争战略 五、标杆瞄准战略
文件格式: PPT大小: 244KB页数: 61

企业经营思想 企业愿景的含义 企业使命的含义 企业使命的陈述 目标体系的建立
文件格式: PPT大小: 754.5KB页数: 42

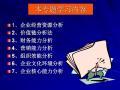
1、企业经营资源分析 2、价值链分析法 3、财务能力分析 4、营销能力分析 5、组织效能分析 6、企业文化环境分析 7、企业核心能力分析
文件格式: PPT大小: 427.5KB页数: 82
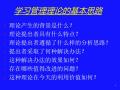
一、战略的概念 二、战略的定义 三、战略的特征 四、战略管理的过程 五、战略管理的层次、体系 六、企业战略管理的作用 七、战略管理者 八、我国企业战略管理
文件格式: PPT大小: 0.99MB页数: 48

吉林大学:《证券投资学》课程电子教案(PPT课件)第十三章 证券投资技术分析
文件格式: PPT大小: 318.5KB页数: 159
