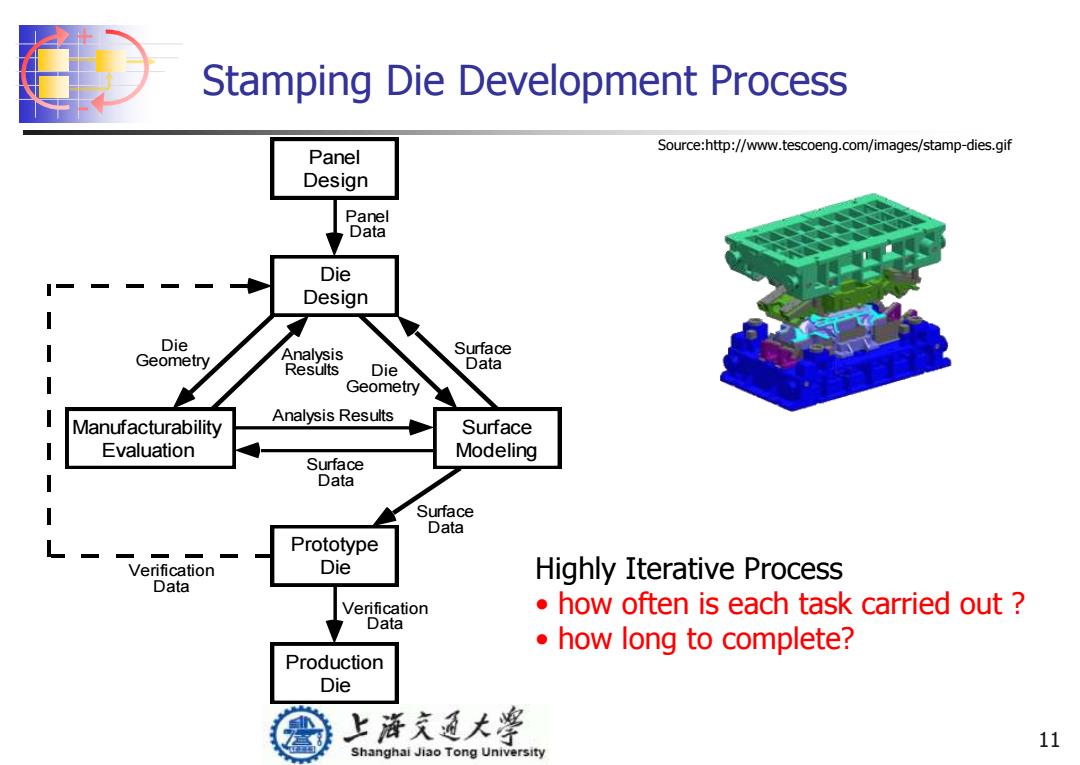
Stamping Die Development Process Source:http://www.tescoeng.com/images/stamp-dies.gif Panel Design Panel Data Die Design Die Analysis Surface Geometry Results Die Data Geometry Manufacturability Analysis Results Surface Evaluation Modeling Surface Data Surface Data L Prototype Verification Die Highly Iterative Process Data Verification how often is each task carried out Data ·how long to complete? Production Die 上海充通大¥ 11 Shanghai Jiao Tong University
+ - 11 Stamping Die Development Process Panel Design Die Design Manufacturability Evaluation Prototype Die Production Die Surface Modeling Panel Data Verification Data Surface Data Analysis Results Surface Data Surface Data Analysis Results Die Geometry Die Geometry Verification Data Highly Iterative Process • how often is each task carried out ? • how long to complete? Source:http://www.tescoeng.com/images/stamp-dies.gif
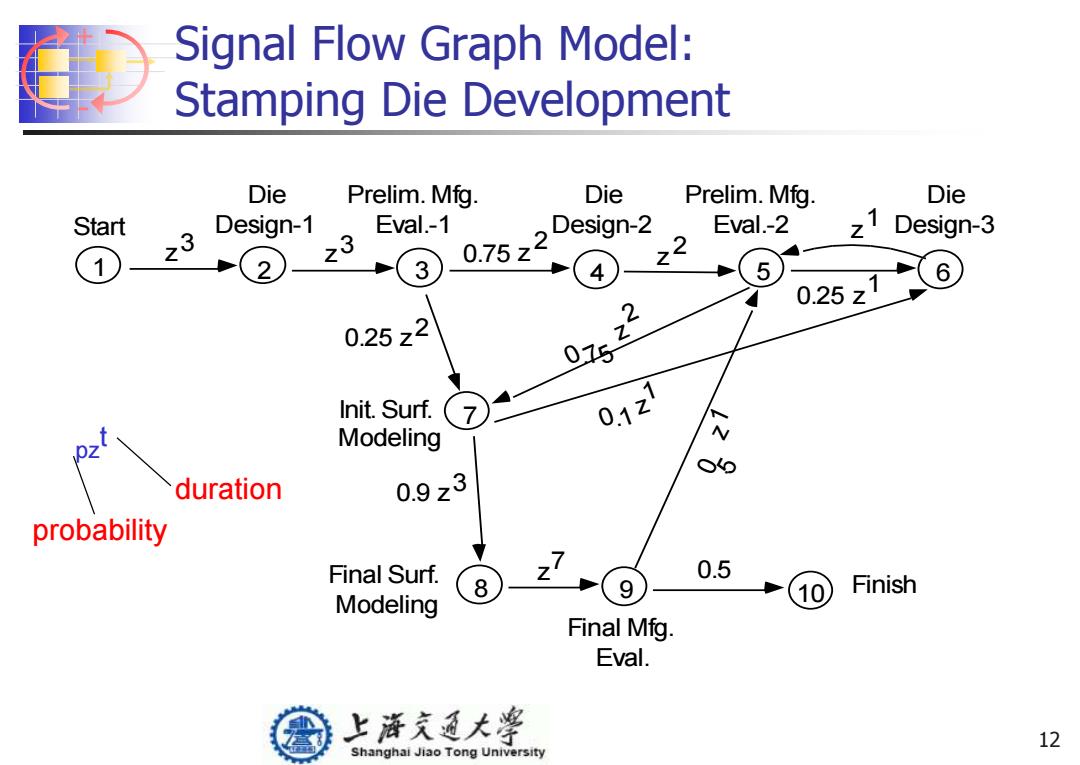
Signal Flow Graph Model: Stamping Die Development Die Prelim.Mfg. Die Prelim.Mfg. Die Start Design-1 Eval.-1 0.75zDesign2 Eval.-2 23 Design-3 33 3 4 5 6 0.25z1 0.25z2 0s23 Init.Surf. 7 01z1 Modeling ⊙0 duration 0.9z3 probability Final Surf. 0.5 8 10 Finish Modeling Final Mfg. Eval. 上海充通大¥ 12 Shanghai Jiao Tong University
+ - 12 Signal Flow Graph Model: Stamping Die Development . 1 2 3 4 5 6 7 8 9 10 Init.Surf. Modeling Final Surf. Modeling 0.75 z 2 z 2 z 2 0.25 z 1 0.25 z 1 z 1 0.1 z 3 0.9 z 7 Finish 0.5 Start 0.75 z 2 z 0 . 5 z 3 z 3 Final Mfg. Eval. Prelim. Mfg. Eval.-1 Prelim. Mfg. Eval.-2 Die Design-1 Die Design-2 Die Design-3 1 pz t duration probability
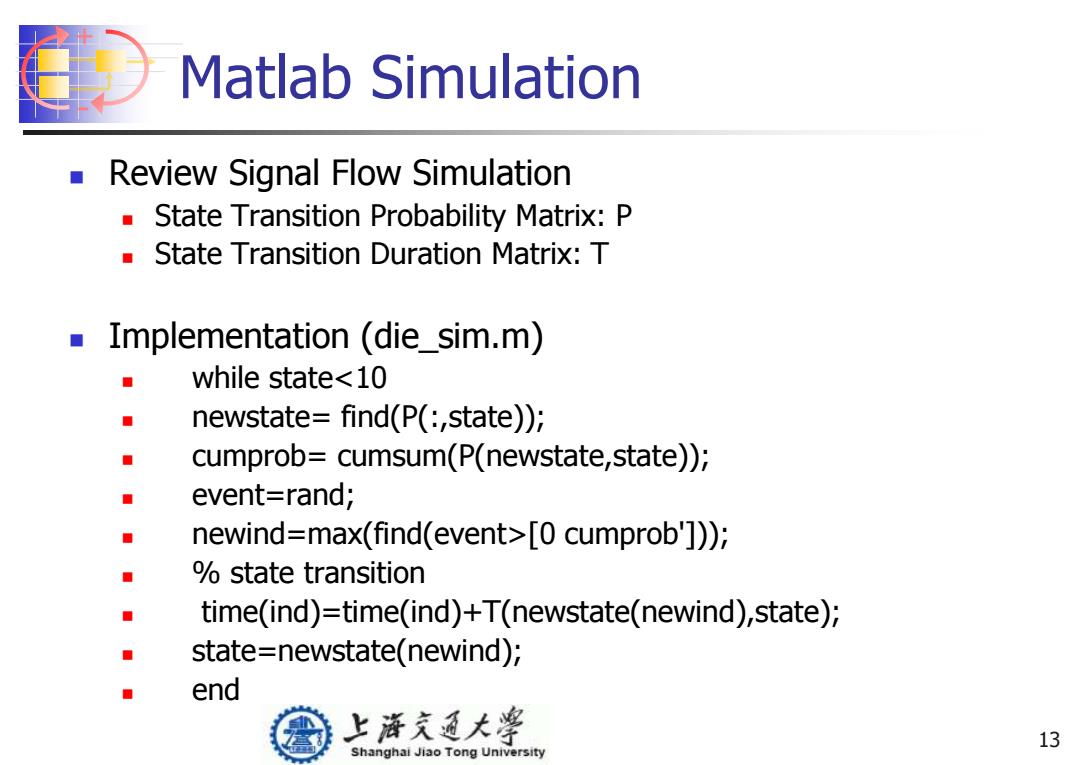
Matlab Simulation Review Signal Flow Simulation State Transition Probability Matrix:P State Transition Duration Matrix:T Implementation (die_sim.m) ■ while state<10 ◆ newstate=find(P(:,state)); ◆ cumprob=cumsum(P(newstate,state)); ■ event=rand; newind=max(find(event>[0 cumprob'])); state transition ■ time(ind)=time(ind)+T(newstate(newind),state); ■ state=newstate(newind); ■ end 上游充通大¥ 13 Shanghai Jiao Tong University
+ - 13 Matlab Simulation Review Signal Flow Simulation State Transition Probability Matrix: P State Transition Duration Matrix: T Implementation (die_sim.m) while state<10 newstate= find(P(:,state)); cumprob= cumsum(P(newstate,state)); event=rand; newind=max(find(event>[0 cumprob'])); % state transition time(ind)=time(ind)+T(newstate(newind),state); state=newstate(newind); end
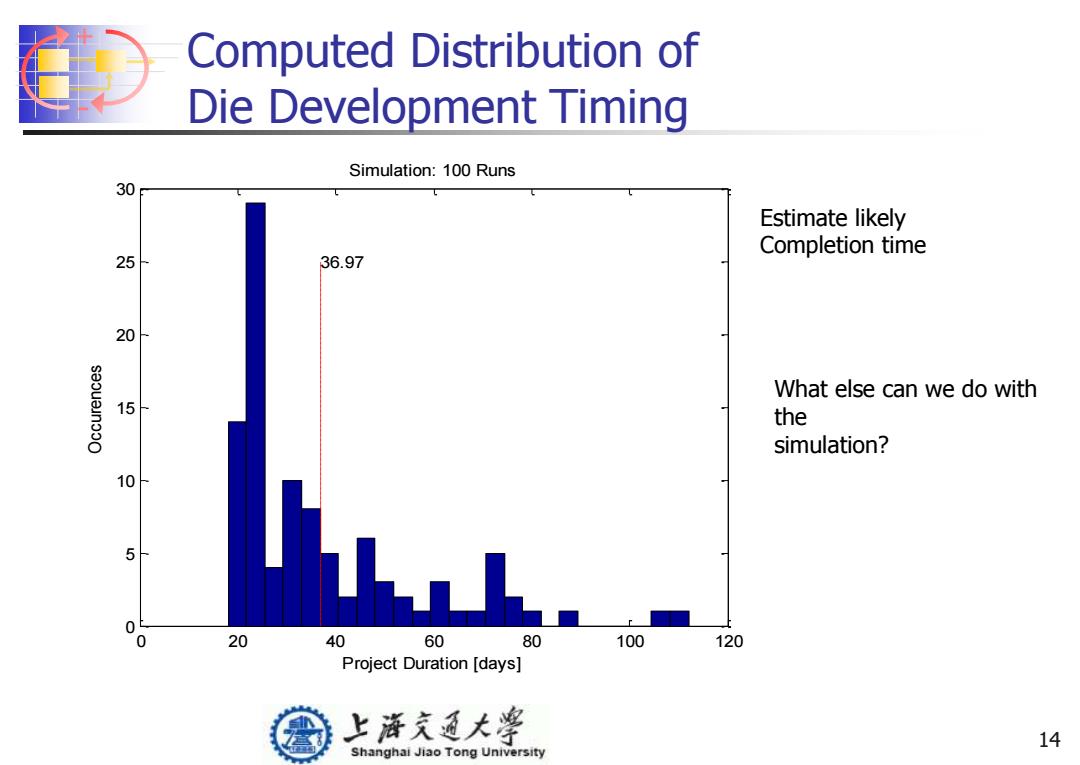
Computed Distribution of Die Development Timing Simulation:100 Runs 30 Estimate likely Completion time 25 36.97 20 What else can we do with 15 the simulation? 10 5 0 0 20 40 60 80 100 120 Project Duration [days] 上浒充通大¥ 14 Shanghai Jiao Tong University
+ - 14 Computed Distribution of Die Development Timing 0 20 40 60 80 100 120 0 5 10 15 20 25 30 Project Duration [days] Occurences Simulation: 100 Runs 36.97 Estimate likely Completion time What else can we do with the simulation?
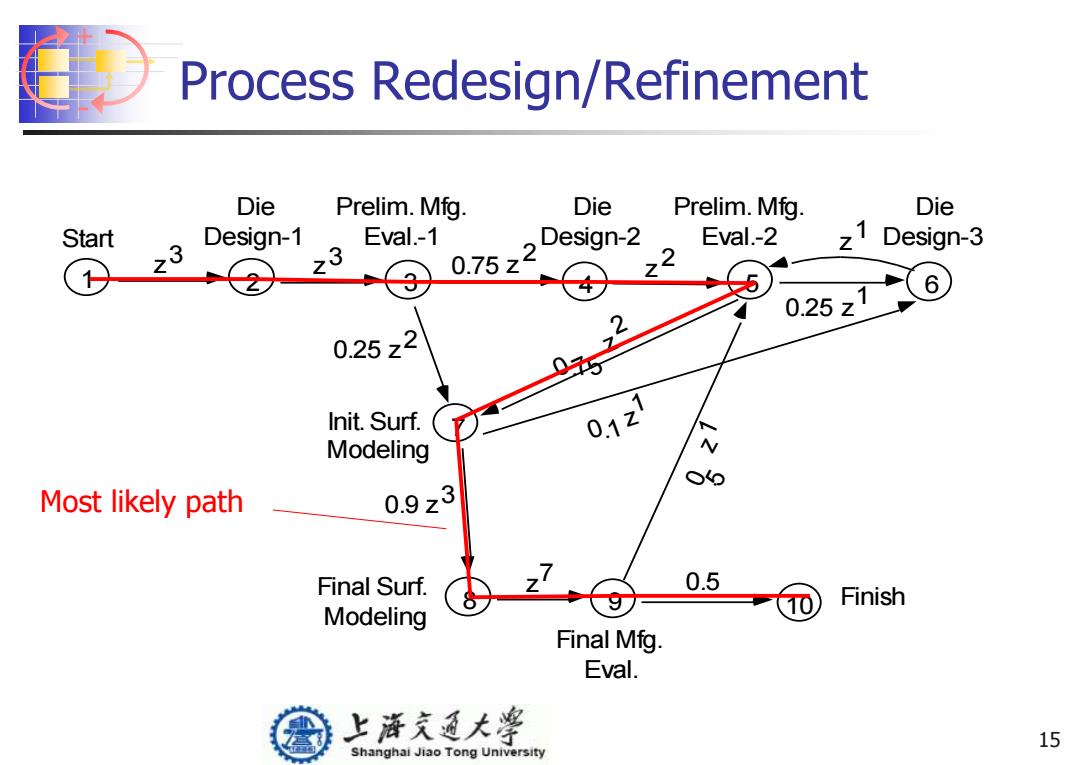
Process Redesign/Refinement Die Prelim.Mfg. Die Prelim.Mfg. Die Start Design-1 Eval.-1 0.75z2Design-2 Eval.-2 z1 Design-3 3 22 6 2 0.25z1 0.25z2 05 Init.Surf. 01z1 Modeling op Most likely path 0.9z3 Final Surf. 0.5 Finish Modeling Final Mfg. Eval. 上海充通大¥ 15 Shanghai Jiao Tong University
+ - 15 Process Redesign/Refinement . 1 2 3 4 5 6 7 8 9 10 Init.Surf. Modeling Final Surf. Modeling 0.75 z 2 z 2 z 2 0.25 z 1 0.25 z 1 z 1 0.1 z 3 0.9 z 7 Finish 0.5 Start 0.75 z 2 z 0 . 5 z 3 z 3 Final Mfg. Eval. Prelim. Mfg. Eval.-1 Prelim. Mfg. Eval.-2 Die Design-1 Die Design-2 Die Design-3 1 Most likely path