Firm 1's profit-maximizing output depends on how much it thinks Firm 2 will produce.If it thinks Firm 2 will produce nothing,its demand curve,labeled D (0),is the market demand curve.The corresponding marginal revenue curve,labeled MR (0),intersects Firm 1's marginal cost curve MC at an output of 50 units
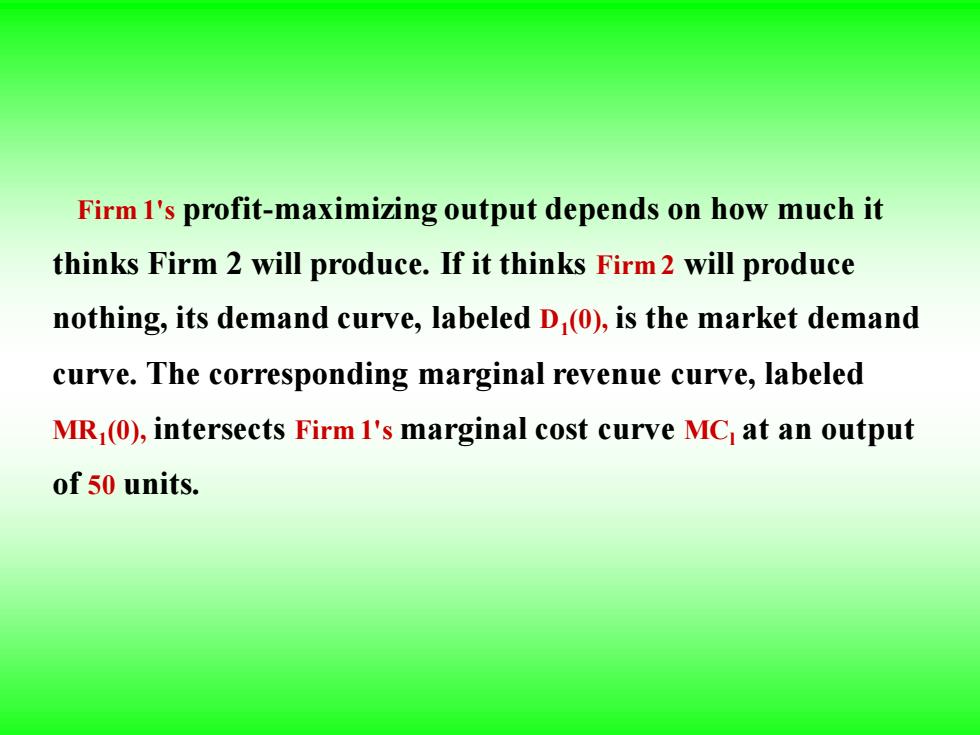
Firm 1's profit-maximizing output depends on how much it thinks Firm 2 will produce. If it thinks Firm 2 will produce nothing, its demand curve, labeled D1 (0), is the market demand curve. The corresponding marginal revenue curve, labeled MR1 (0), intersects Firm 1's marginal cost curve MCl at an output of 50 units
If Firm 1 thinks Firm 2 will produce 50 units,its demand curve, D (50),is shifted to the left by this amount.Profit maximization now implies an output of 25 units. Finally,if Firm 1 thinks Firm 2 will produce 75 unit,Firm 1 will produce only 12.5 units
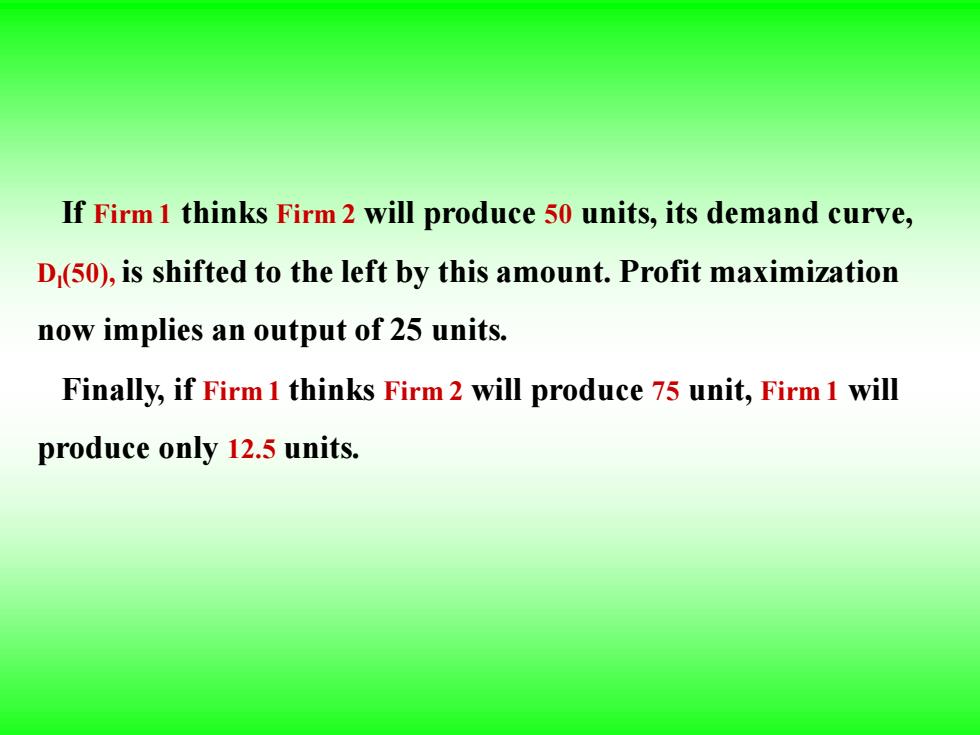
If Firm 1 thinks Firm 2 will produce 50 units, its demand curve, Dl (50), is shifted to the left by this amount. Profit maximization now implies an output of 25 units. Finally, if Firm 1 thinks Firm 2 will produce 75 unit, Firm 1 will produce only 12.5 units
12.2.1 The Cournot Model Reaction curve-Relationship between a firm's profit-maximizing output and the amount it thinks its competitor will produce. Cournot equilibrium-Equilibrium in the Cournot model, in which each firm correctly assumes how much its competitor will produce and sets its own production level accordingly
12.2.1 The Cournot Model Reaction curve - Relationship between a firm’s profit-maximizing output and the amount it thinks its competitor wi1l produce. Cournot equilibrium - Equilibrium in the Cournot model, in which each firm correctly assumes how much its competitor will produce and sets its own production level accordingly

Q1 100 Firm 2's Reaction 75 Curve Q2(Q1) 50名 Cournot Equilibrium 25 Firm 1's Reaction XS 12.5 Curve Qi(Q2) 25 50 75 100 Q2 Reaction Curves and Cournot Equilibrium
Reaction Curves and Cournot Equilibrium XS
Firm I's reaction curve shows how much it will produce as a function of how much it thinks Firm 2 will produce.(The XS, at Q2=0,50 and 75,correspond to the last examples) Firm 2's reaction curve shows its output as a function of how much it thinks Firm 1 will produce
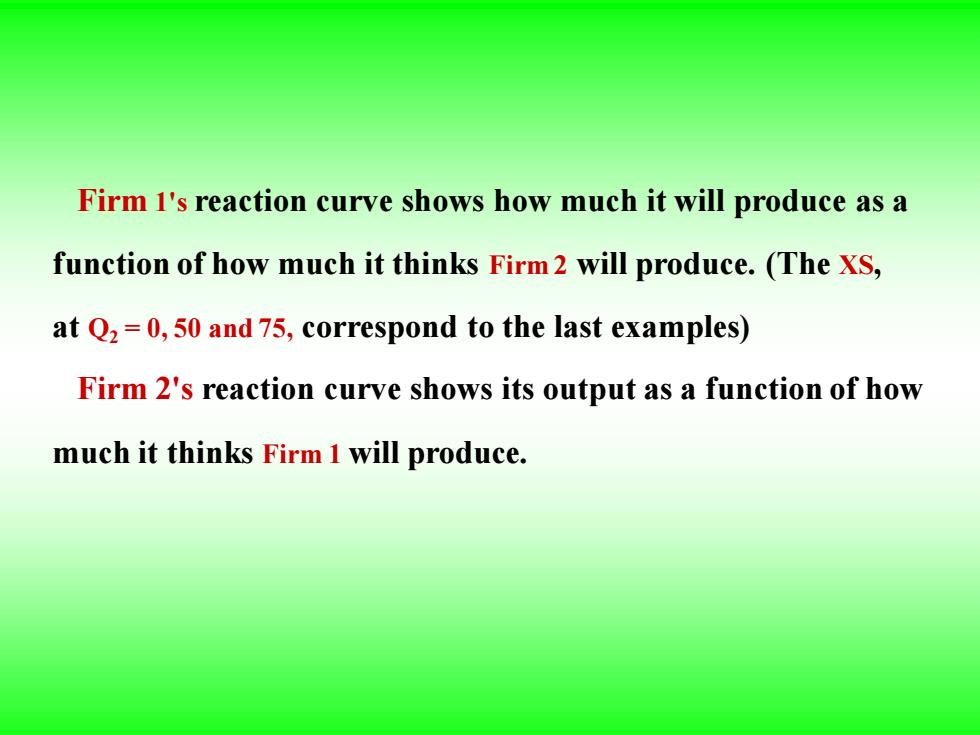
Firm 1's reaction curve shows how much it will produce as a function of how much it thinks Firm 2 will produce. (The XS, at Q2 = 0, 50 and 75, correspond to the last examples) Firm 2's reaction curve shows its output as a function of how much it thinks Firm 1 will produce