滋 料卧价复多土岁 UNIVERSITY OF INTERNATIONAL BUSINESS AND ECONOMICS 第七章库存管理
第七章 库存管理
對卧价質多大岁 1951 UNIVERSITY OF INTERNATIONAL BUSINESS AND ECONOMICS 主要内容 口7.1企业库存 口7.2库存管理战略 口7.3库存管理方法 口7.4推动式库存管理模型 口7.5拉动式库存管理模型 口7.6两种库存控制方法比较 2
2 主要内容 7.1 企业库存 7.2 库存管理战略 7.3 库存管理方法 7.4 推动式库存管理模型 7.5 拉动式库存管理模型 7.6 两种库存控制方法比较
對计价質多大岁 1951 UNIVERSITY OF INTERNATIONAL BUSINESS AND ECONOMICS 7.1企业库存 口7.1.1库存是企业一项庞大的资产 口7.1.2企业持有库存的原因 口7.1.3库存的种类 口7.1.4影响库存的因素 3
3 王晓东,胡瑞娟 7.1 企业库存 7.1.1 库存是企业一项庞大的资产 7.1.2 企业持有库存的原因 7.1.3 库存的种类 7.1.4 影响库存的因素
武价复多本岁 1951 UNIVERSITY OF INTERNATIONAL BUSNESS AND ECONOMICS 7.1.1库存是企业一项庞大的资产 Companles Sales Net Profits Net Profits as a Total Assets Inventory Investment Inventorles as a Percent of Sales Percent of Assets Manufacturers Abbott Laboratories $11.883 $2,094 18% $12.061 $1,280 11% Borden,Inc. 1,488 221 15% 2.206 302 14% The Clorox Company 2,741 298 11% 3.030 212 7% Dresser Industries,Inc 7,458 318 4% 5.099 972 19% Ford Motor Company 153.627 6.920 5% 279.097 5.468 2% General Electric Company 90,840 8.203 9% 304.012 5.895 2% General Mills 6.033 422 7% 3.861 389 10% Goodyear Tire Rubber Co. 13,065 559 4% 9.917 1,835 19% Harris Corp. 3,939 133 3% 3.784 604 16% Honeywell Co. 8,028 471 6% 6,411 1.028 16% NCR Corp. 6,598 7 0.11% 5.293 489 9% Newell Co. 3.234 290 9% 3,944 625 16% Pfizer,Inc. 12,188 2,213 18% 15,336 1,773 12% Sara Lee Corp. 20,011 (523) -3% 10,989 2,882 26% Xerox Corp. 18,166 1.452 8% 27.732 2,792 10% Wholesalers and Retailers Baxter International 6,138 300 5% 8.707 1.208 14% Bergen Brunswig Corp. 11,661 82 1% 2.707 1.309 48% Dayton Hudson Corp. 27.757 751 3% 14.191 3.251 23% Fleming Companies.Inc. 15,372 25 0.16% 3,924 1,019 26% Kmart Corporation 32,183 249 1% 13,558 6.367 47% Nordstrom 4,852 186 4% 2.865 826 29% Sears,Roebuck Company 41.296 1.188 3% 38.700 5,044 13% Supervalu Inc. 17,201 231 1% 4.093 1,116 27% Wal-Mart Stores,Inc. 117,958 3.526 3% 45,384 16.497 36% Winn-Dixie 13,219 204 2% 2.921 1.249 43% Note:Ending inventory figures are used for inventory investment.All figures are for 1997. 4Selected Financial Data for Manufacturers,Wholesalers,and Retailers for 1997($Millions)
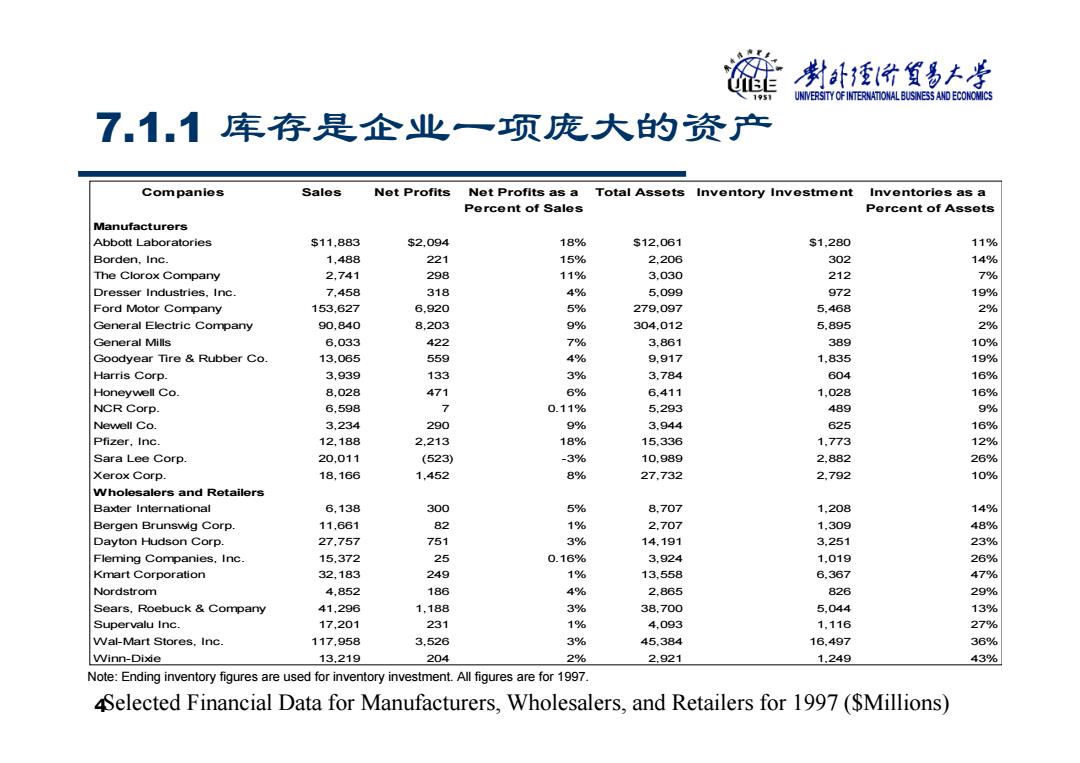
4 Companies Sales Net Profits Net Profits as a Total Assets Inventory Investment Inventories as a Percent of Sales Percent of Assets Manufacturers Abbott Laboratories $11,883 $2,094 18% $12,061 $1,280 11% Borden, Inc. 1,488 221 15% 2,206 302 14% The Clorox Company 2,741 298 11% 3,030 212 7% Dresser Industries, Inc. 7,458 318 4% 5,099 972 19% Ford Motor Company 153,627 6,920 5% 279,097 5,468 2% General Electric Company 90,840 8,203 9% 304,012 5,895 2% General Mills 6,033 422 7% 3,861 389 10% Goodyear Tire & Rubber Co. 13,065 559 4% 9,917 1,835 19% Harris Corp. 3,939 133 3% 3,784 604 16% Honeywell Co. 8,028 471 6% 6,411 1,028 16% NCR Corp. 6,598 7 0.11% 5,293 489 9% Newell Co. 3,234 290 9% 3,944 625 16% Pfizer, Inc. 12,188 2,213 18% 15,336 1,773 12% Sara Lee Corp. 20,011 (523) -3% 10,989 2,882 26% Xerox Corp. 18,166 1,452 8% 27,732 2,792 10% Wholesalers and Retailers Baxter International 6,138 300 5% 8,707 1,208 14% Bergen Brunswig Corp. 11,661 82 1% 2,707 1,309 48% Dayton Hudson Corp. 27,757 751 3% 14,191 3,251 23% Fleming Companies, Inc. 15,372 25 0.16% 3,924 1,019 26% Kmart Corporation 32,183 249 1% 13,558 6,367 47% Nordstrom 4,852 186 4% 2,865 826 29% Sears, Roebuck & Company 41,296 1,188 3% 38,700 5,044 13% Supervalu Inc. 17,201 231 1% 4,093 1,116 27% Wal-Mart Stores, Inc. 117,958 3,526 3% 45,384 16,497 36% Winn-Dixie 13,219 204 2% 2,921 1,249 43% Note: Ending inventory figures are used for inventory investment. All figures are for 1997. Selected Financial Data for Manufacturers, Wholesalers, and Retailers for 1997 ($Millions) 7.1.1 库存是企业一项庞大的资产

對计价質多大岁 1951 UNIVERSITY OF INTERNATIONAL BUSINESS AND ECONOMICS 7.1.2持有库存的原因 口提高客户服务水平 口鼓励专业化经营,实现规模经济效益 口在不同经营环节之间起到缓冲作用 口平衡供需矛盾 口有助于生产的顺利进行 ▣应对突发情事件 5
5 7.1.2 持有库存的原因 提高客户服务水平 鼓励专业化经营,实现规模经济效益 在不同经营环节之间起到缓冲作用 平衡供需矛盾 有助于生产的顺利进行 应对突发情事件 ……