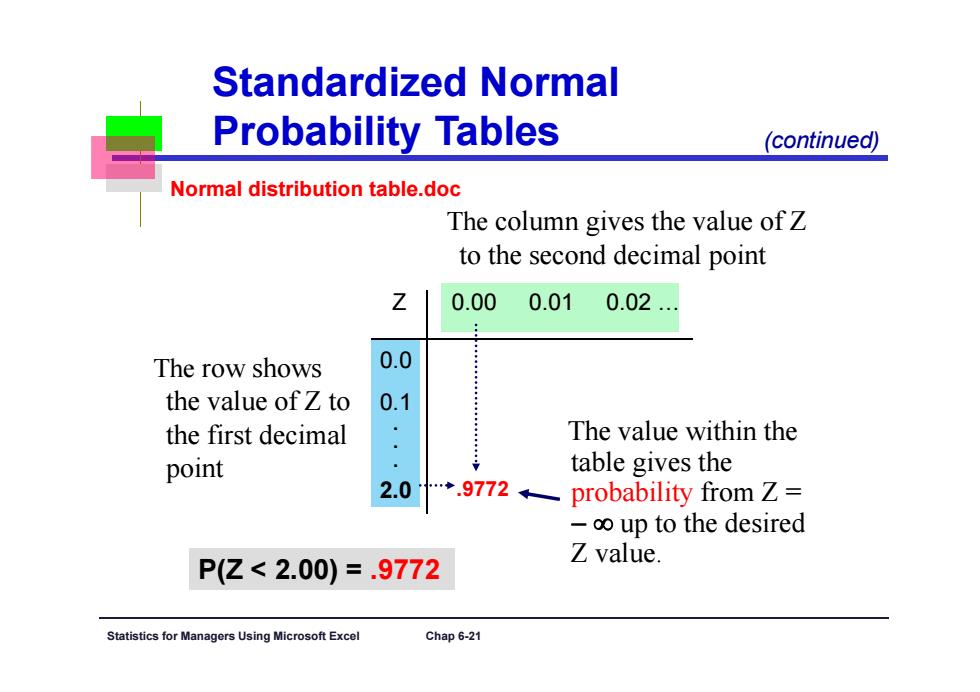
Standardized Normal Probability Tables (continued) Normal distribution table.doc The column gives the value ofZ to the second decimal point Z 0.00 0.01 0.02… The row shows 0.0 the value of Z to 0.1 the first decimal The value within the point table gives the 2.0 *.9772 probability from Z= -oo up to the desired Z value. P(Z<2.00)=.9772 Statistics for Managers Using Microsoft Excel Chap 6-21
Statistics for Managers Using Microsoft Excel Chap 6-21 The value within the table gives the probability from Z = up to the desired Z value. .9772 P(Z < 2.00) = .9772 2.0 The row shows the value of Z to the first decimal point The column gives the value of Z to the second decimal point 2.0 . . . Z 0.00 0.01 0.02 … 0.0 0.1 Standardized Normal Probability Tables (continued) Normal distribution table.doc
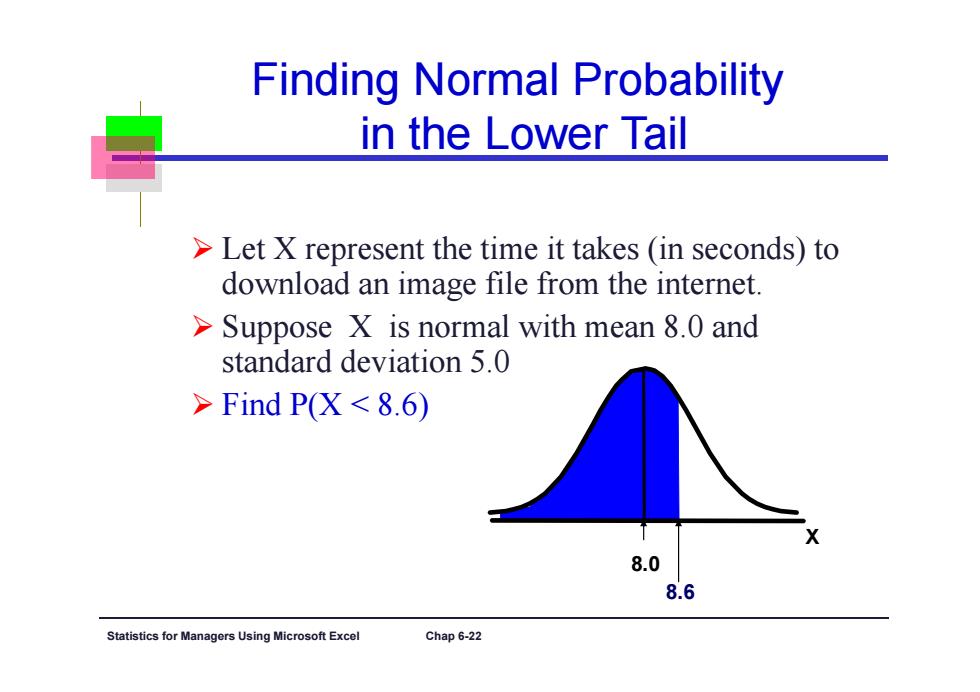
Finding Normal Probability in the Lower Tail Let X represent the time it takes (in seconds)to download an image file from the internet. >Suppose X is normal with mean 8.0 and standard deviation 5.0 Find P(X<8.6) 8.0 8.6 Statistics for Ma agers Using Microsoft Excel Chap 6-22
Statistics for Managers Using Microsoft Excel Chap 6-22 Finding Normal Probability in the Lower Tail Let X represent the time it takes (in seconds) to download an image file from the internet. Suppose X is normal with mean 8.0 and standard deviation 5.0 Find P(X < 8.6) X 8.6 8.0

Finding Normal Probability in the Lower Tail (continued) Suppose X is normal with mean 8.0 and standard deviation 5.0,X~N(8.0,25).Find P(X<8.6). 2=X-4-8.6-8.0 =0.12 0 5.0 4=8 u=0 0=5 88.6 00.12 PX<8.6) P(Z<0.12) Statistics for Managers Using Microsoft Excel Chap 6-23
Statistics for Managers Using Microsoft Excel Chap 6-23 Finding Normal Probability in the Lower Tail 0.12 5.0 8.6 8.0 σ X μ Z Suppose X is normal with mean 8.0 and standard deviation 5.0, X~N(8.0, 25). Find P(X < 8.6). X 8 8.6 μ = 8 σ = 5 P(X < 8.6) Z 0 0.12 μ = 0 σ = 1 P(Z < 0.12) (continued)
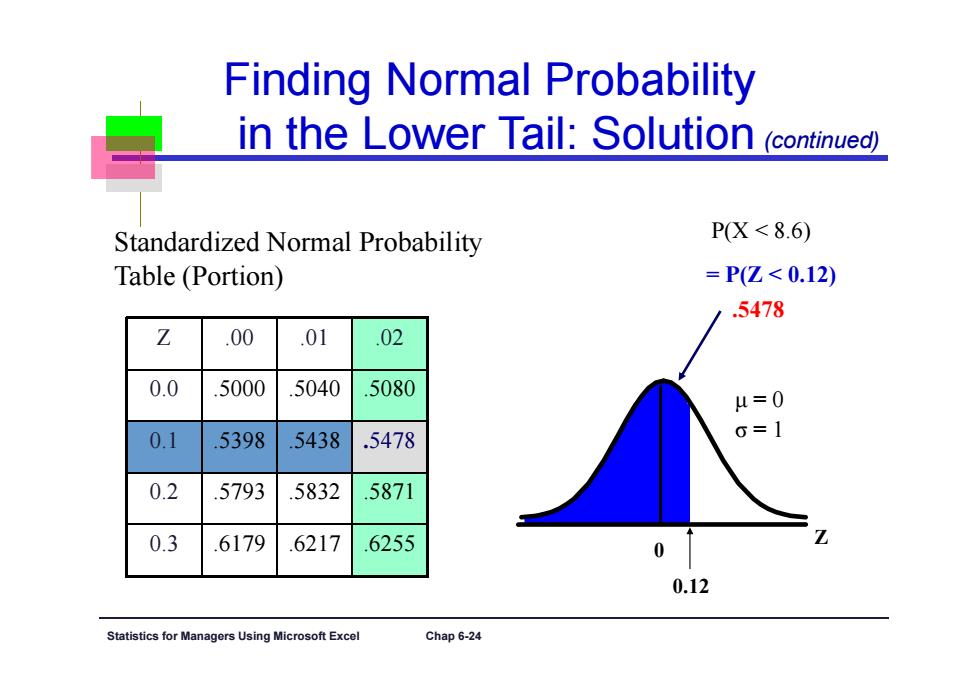
Finding Normal Probability in the Lower Tail:Solution (Continuea) Standardized Normal Probability PX<8.6) Table(Portion) =P(Z<0.12) .5478 Z .00 .01 02 0.0 .5000 .5040 5080 4=0 0.1 5398 5438 .5478 G=1 0.2 .5793 5832 5871 0.3 6179 6217 6255 0 0.12 Statistics for agers Using Microsoft Excel Chap 6-24
Statistics for Managers Using Microsoft Excel Chap 6-24 Finding Normal Probability in the Lower Tail: Solution Z .00 .01 .02 0.0 .5000 .5040 .5080 0.1 .5398 .5438 .5478 0.2 .5793 .5832 .5871 0.3 .6179 .6217 .6255 Standardized Normal Probability Table (Portion) Z 0.12 0 μ = 0 σ = 1 .5478 = P(Z < 0.12) P(X < 8.6) (continued)
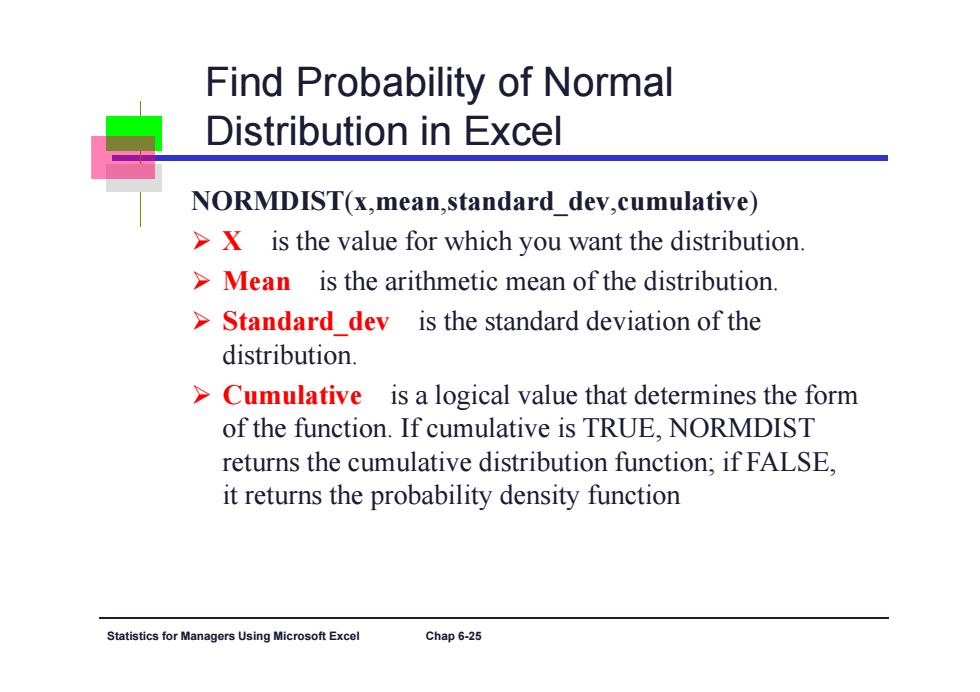
Find Probability of Normal Distribution in Excel NORMDIST(x,mean,standard dev,cumulative) >X is the value for which you want the distribution. >Mean is the arithmetic mean of the distribution. >Standard dev is the standard deviation of the distribution. >Cumulative is a logical value that determines the form of the function.If cumulative is TRUE,NORMDIST returns the cumulative distribution function;if FALSE, it returns the probability density function Statistics for Managers Using Microsoft Excel Chap 6-25
Statistics for Managers Using Microsoft Excel Chap 6-25 Find Probability of Normal Distribution in Excel NORMDIST ( x,mean,standard_dev,cumulative ) X is the value for which you want the distribution. Mean is the arithmetic mean of the distribution. Standard_dev is the standard deviation of the distribution. Cumulative is a logical value that determines the form of the function. If cumulative is TRUE, NORMDIST returns the cumulative distribution function; if FALSE, it returns the probability density function