Chapter 13 Statistical Applications in Quality Management Statistics for Managers Using Microsoft Excel
Statistics for Managers Using Microsoft Excel Chapter 13 Statistical Applications in Quality Management
Learning Objectives In this chapter,you learn: How to construct various control charts Which control charts to use for a particular type of data How to measure the capability of a process The basic themes of quality management and Deming's 14 points The basic aspects of Six Sigma Statistics for Managers Using Microsoft Excel
Statistics for Managers Using Microsoft Excel Learning Objectives In this chapter, you learn: How to construct various control charts Which control charts to use for a particular type of data How to measure the capability of a process The basic themes of quality management and Deming’s 14 points The basic aspects of Six Sigma
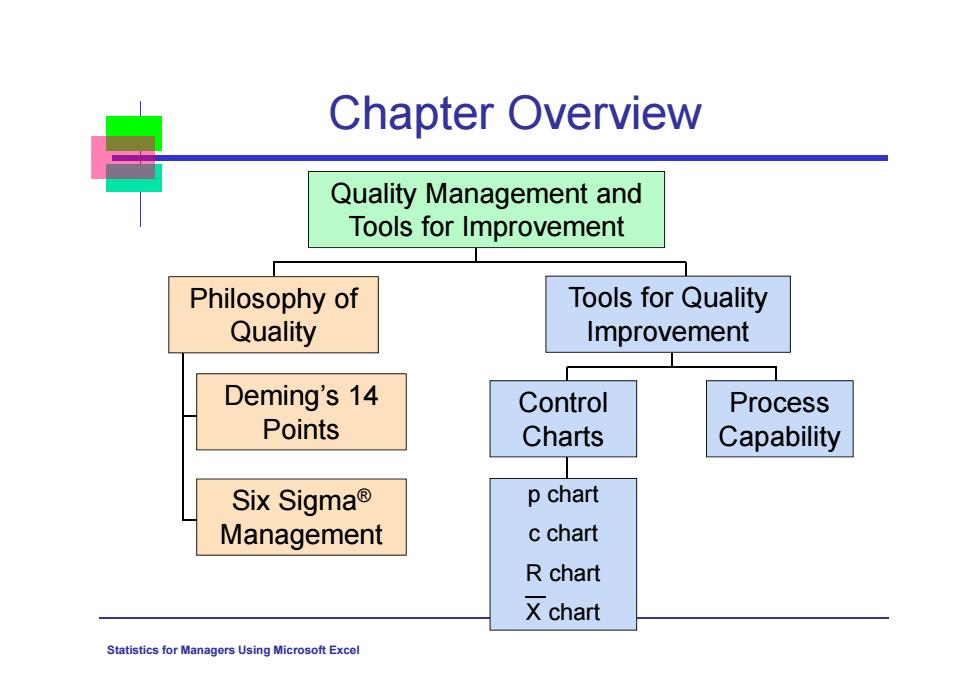
Chapter Overview Quality Management and Tools for Improvement Philosophy of Tools for Quality Quality Improvement Deming's 14 Control Process Points Charts Capability Six Sigma® p chart Management c chart R chart X chart Statistics for Managers Using Microsoft Excel
Statistics for Managers Using Microsoft Excel Chapter Overview Quality Management and Tools for Improvement Deming’s 14 Points Six Sigma® Management Process Capability Philosophy of Quality Tools for Quality Improvement Control Charts p chart c chart R chart X chart

Theory of Control Charts DCOVA A process is the value added transformation of inputs to outputs Control Charts are used to monitor variation in a measured value from a process Inherent variation refers to process variation that exists naturally.This variation can be reduced but not eliminated Statistics for Managers Using Microsoft Excel
Statistics for Managers Using Microsoft Excel Theory of Control Charts A process is the value added transformation of inputs to outputs Control Charts are used to monitor variation in a measured value from a process Inherent variation refers to process variation that exists naturally. This variation can be reduced but not eliminated DCOVA
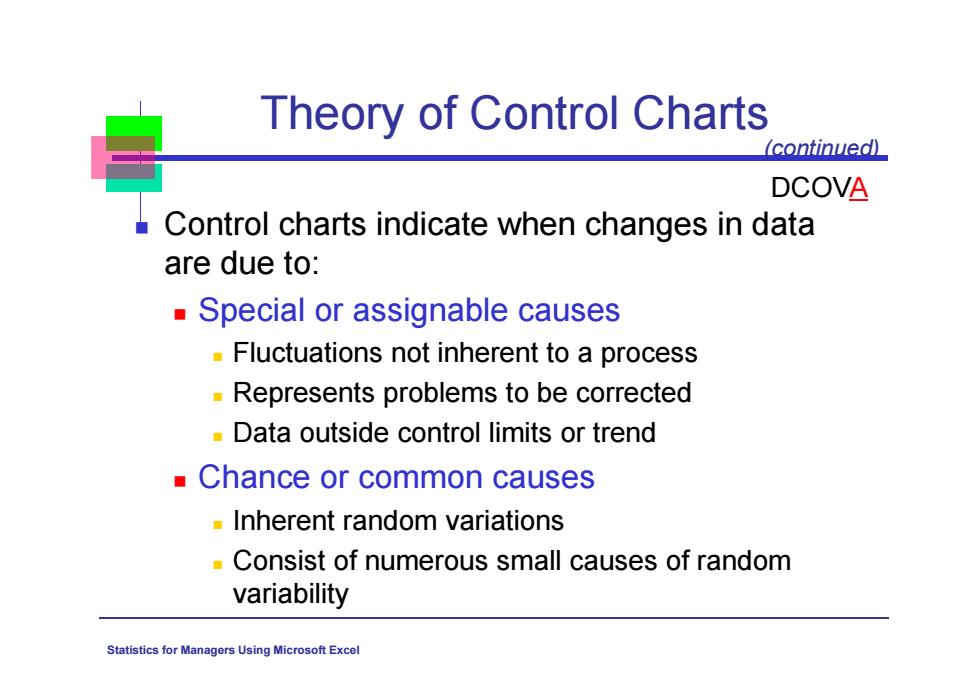
Theory of Control Charts (continued) DCOVA Control charts indicate when changes in data are due to: Special or assignable causes Fluctuations not inherent to a process -Represents problems to be corrected Data outside control limits or trend Chance or common causes -Inherent random variations Consist of numerous small causes of random variability Statistics for Managers Using Microsoft Excel
Statistics for Managers Using Microsoft Excel Theory of Control Charts Control charts indicate when changes in data are due to: Special or assignable causes Fluctuations not inherent to a process Represents problems to be corrected Data outside control limits or trend Chance or common causes Inherent random variations Consist of numerous small causes of random variability (continued) DCOVA