
The Standardized Normal Distribution:Example If X is distributed normally with mean of 100 and standard deviation of 50,the Z value for X=200 is 2= X-u_200-100 =2.0 6 50 > This says that X=200 is two standard deviations (2 increments of 50 units)above the mean of 100. Statistics for Managers Using Microsoft Excel Chap 6-16
Statistics for Managers Using Microsoft Excel Chap 6-16 If X is distributed normally with mean of 100 and standard deviation of 50, the Z value for X = 200 is This says that X = 200 is two standard deviations (2 increments of 50 units) above the mean of 100. The Standardized Normal Distribution: Example 2.0 50 200 100 σ X μ Z
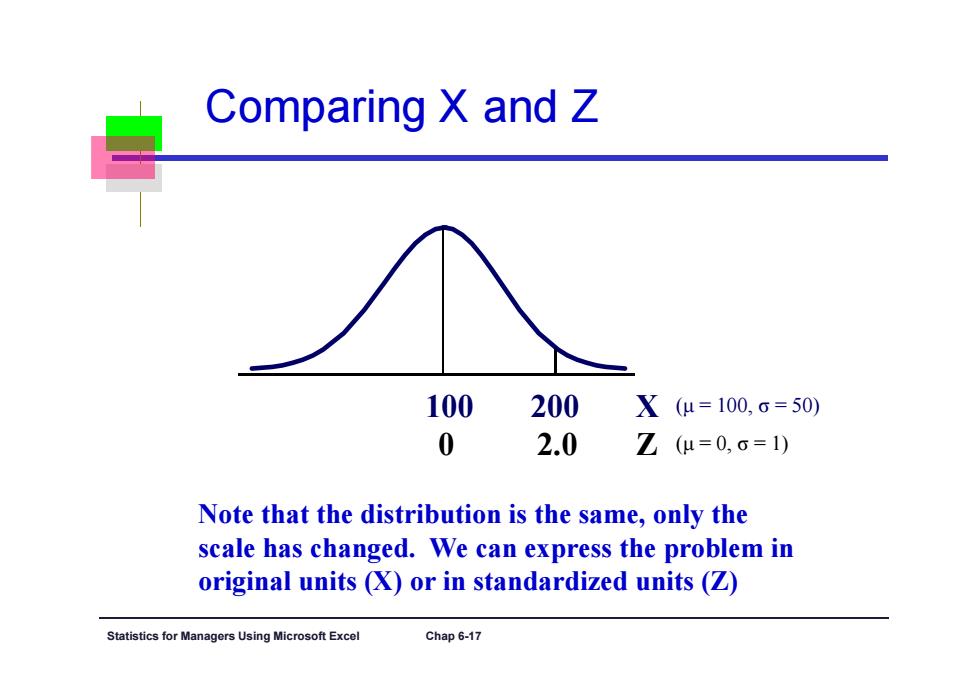
Comparing X and Z 100 200 X(μ=100,ō=50) 0 2.0 Z(μ=0,ō=1) Note that the distribution is the same,only the scale has changed.We can express the problem in original units(X)or in standardized units(Z) Statistics for Ma nagers Using Microsoft Excel Chap 6-17
Statistics for Managers Using Microsoft Excel Chap 6-17 Comparing X and Z Z 100 0 2.0 200 X ( μ = 100, σ = 50) ( μ = 0, σ = 1) Note that the distribution is the same, only the scale has changed. We can express the problem in original units (X) or in standardized units (Z)

Finding Normal Probabilities Probability is measured by the area under the curve f(X) P(a≤X≤b) =P(a<X<b) _(Note that the probability a b of any individual value is zero) Statistics for Managers Using Microsoft Excel Chap 6-18
Statistics for Managers Using Microsoft Excel Chap 6-18 Finding Normal Probabilities a b f(X) (Note that the probability of any individual value is zero) Probability is measured by the area under the curve P(a ≤ X ≤ b) = P ( a < X < b )
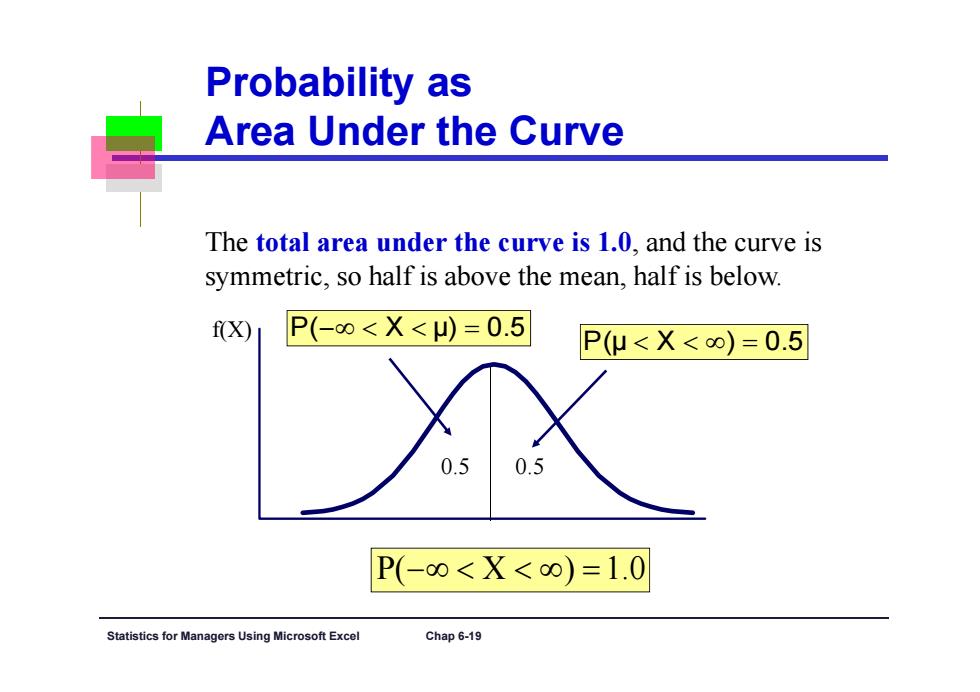
Probability as Area Under the Curve The total area under the curve is 1.0,and the curve is symmetric,so half is above the mean,half is below. f(X) P(-0<X<)=0.5 P(u<X<o)=0.5 0.5 0.5 P(-0<X<o)=1.0 Statistics for Managers Using Microsoft Excel Chap 6-19
Statistics for Managers Using Microsoft Excel Chap 6-19 Probability as Area Under the Curve The total area under the curve is 1.0, and the curve is symmetric, so half is above the mean, half is below. f(X) 0.5 0.5 P( X ) 1.0 P( μ X ) 0.5 P( X μ ) 0.5
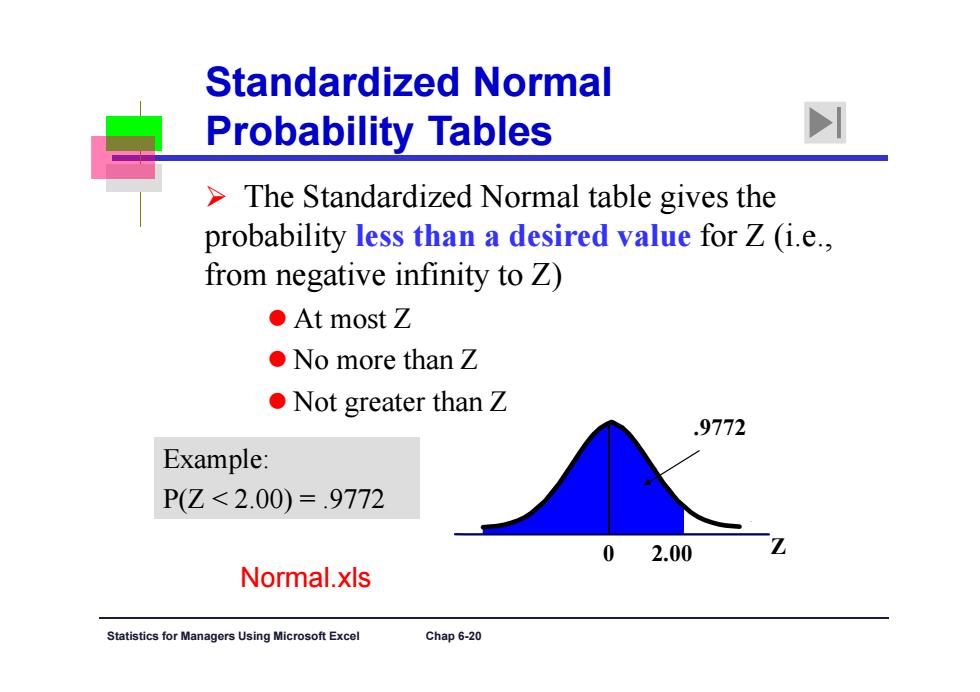
Standardized Normal Probability Tables I The Standardized Normal table gives the probability less than a desired value for Z(i.e., from negative infinity to Z) ●At most Z ●No more than Z ●Not greater than Z .9772 Example: P(Z<2.00)=.9772 0 2.00 Normal.xls Statistics for Ma agers Using Microsoft Excel Chap 6-20
Statistics for Managers Using Microsoft Excel Chap 6-20 Standardized Normal Probability Tables Example: P(Z < 2.00) = .9772 The Standardized Normal table gives the probability less than a desired value for Z (i.e., from negative infinity to Z) At most Z No more than Z Not greater than Z 0 2.00 Z .9772 Normal.xls