Statistics for Managers Using Microsoft Excel Chapter 9 Two-Sample Tests Statistics for Managers Using Microsoft Excel Chap 9-1
Statistics for Managers Using Microsoft Excel Chap 9-1 Chapter 9 Two-Sample Tests Statistics for Managers Using Microsoft Excel
Learning Goals After completing this chapter,you should be able to: Test hypotheses for the difference between two independent population means(standard deviations known or unknown) Test two means from related samples for the mean difference Complete a Z test for the difference between two proportions Use the F table to find critical F values Complete an F test for the difference between two variances Statistics for Managers Using Microsoft Excel Chap9-2
Statistics for Managers Using Microsoft Excel Chap 9-2 Learning Goals After completing this chapter, you should be able to: Test hypotheses for the difference between two independent population means (standard deviations known or unknown) Test two means from related samples for the mean difference Complete a Z test for the difference between two proportions Use the F table to find critical F values Complete an F test for the difference between two variances
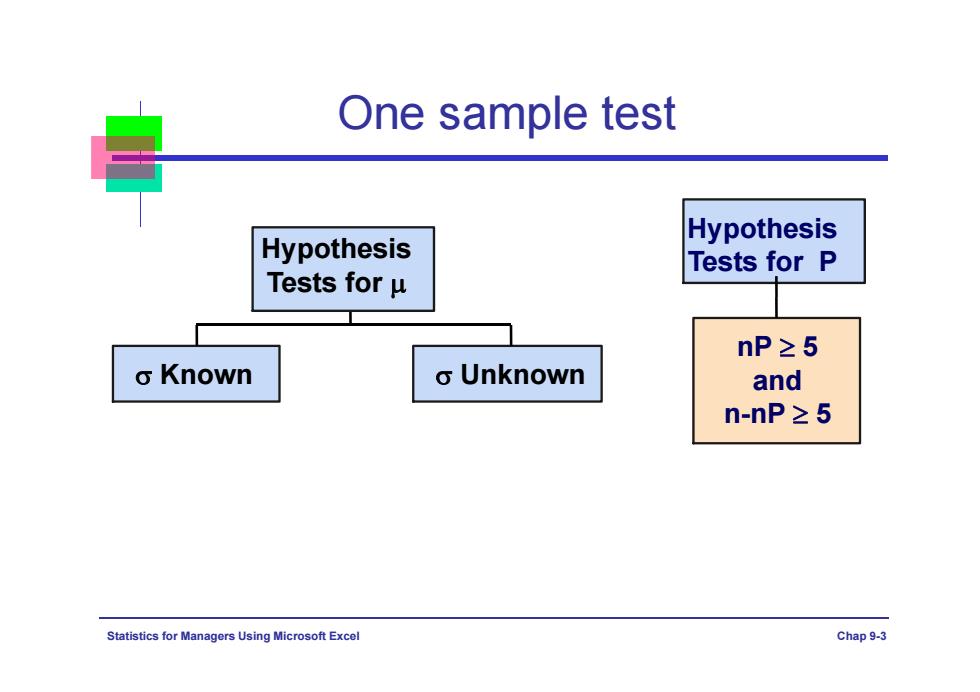
One sample test Hypothesis Hypothesis Tests for P Tests for u nP≥5 o Known o Unknown and n-nP≥5 Statistics for Ma nagers Using Microsoft Excel Chap 9-3
Statistics for Managers Using Microsoft Excel Chap 9-3 One sample test Known Unknown Hypothesis Tests for nP 5 and n-nP 5 Hypothesis Tests for P

Ho Condition Test H Rejection Statistic Area One u丰0 IZZan sample X-40 population 02 oln u<uo Z<-Za =40 known u>0 ZzLa One 02 u≠o t>ta/2(n-1) sample unknown t= 又- population SIn u<0 1<-t(n-1) M=40 u>40 t>i(n-1) hp≥5, P,卡p IZZan One Z= ps-p and sample p1-p) 卫.<卫 Z<-Z。 population n(1-p)≥5 P=卫 PsP L>Za
n X Z / 0 μ ≠ μ 0 μ > μ 0 μ < μ 0 / 2 | | Z Z Z Z Z Z H 0 Condition Test Statistic H1 Rejection Area One sample population μ = μ 0 σ 2 known S n X t / 0 μ ≠ μ 0 μ > μ 0 μ < μ 0 | | ( 1 ) t t / 2 n t t ( n 1 ) t t ( n 1 ) One sample population μ = μ 0 σ 2 unknown ps > p / 2 | | Z Z Z Z Z Z One sample population P = p ( 1 ) 5 and 5, n p np n p p p p Z s ( 1 ) ps < p ps ≠ p
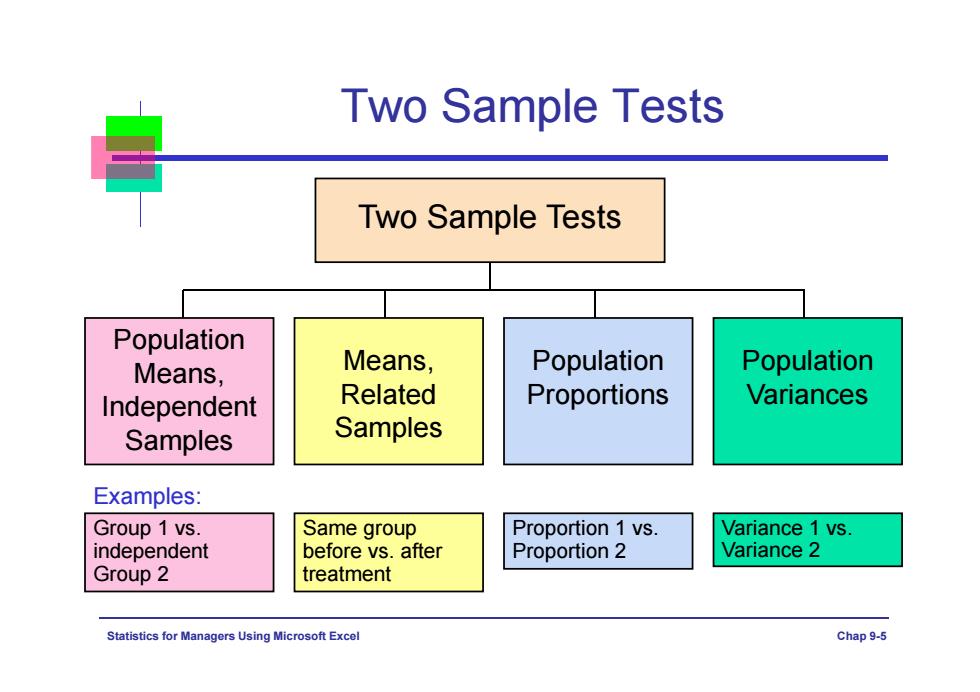
Two Sample Tests Two Sample Tests Population Means, Means, Population Population Independent Related Proportions Variances Samples Samples Examples: Group 1 vs. Same group Proportion 1 vs. Variance 1 vs. independent before vs.after Proportion 2 Variance 2 Group 2 treatment Statistics for Ma agers Using Microsoft Excel Chap 9-5
Statistics for Managers Using Microsoft Excel Chap 9-5 Two Sample Tests Two Sample Tests Population Means, Independent Samples Means, Related Samples Population Variances Group 1 vs. independent Group 2 Same group before vs. after treatment Variance 1 vs. Variance 2 Examples: Population Proportions Proportion 1 vs. Proportion 2