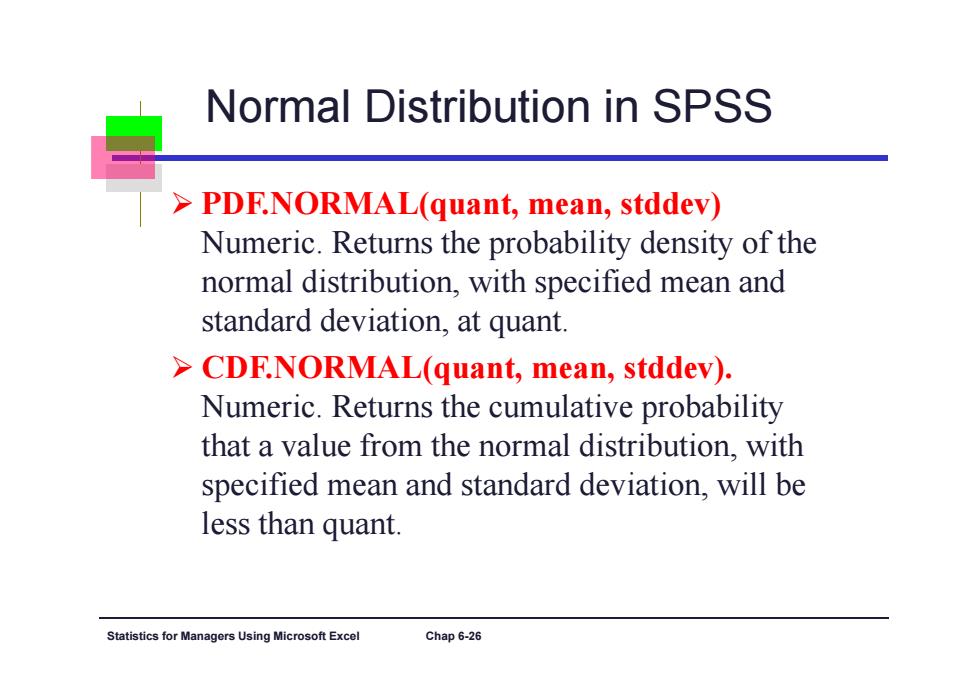
Normal Distribution in SPSS PDF.NORMAL(quant,mean,stddev) Numeric.Returns the probability density of the normal distribution,with specified mean and standard deviation,at quant. CDF.NORMAL(quant,mean,stddev). Numeric.Returns the cumulative probability that a value from the normal distribution,with specified mean and standard deviation,will be less than quant Statistics for Ma agers Using Microsoft Excel Chap 6-26
Statistics for Managers Using Microsoft Excel Chap 6-26 Normal Distribution in SPSS PDF.NORMAL(quant, mean, stddev) Numeric. Returns the probability density of the normal distribution, with specified mean and standard deviation, at quant. CDF.NORMAL(quant, mean, stddev). Numeric. Returns the cumulative probability that a value from the normal distribution, with specified mean and standard deviation, will be less than quant
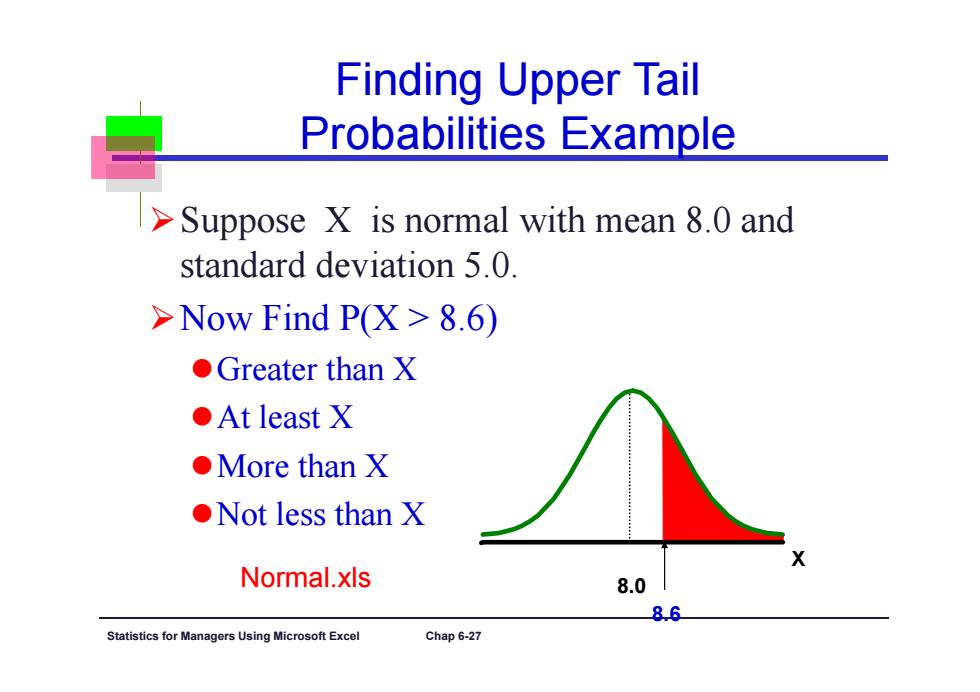
Finding Upper Tail Probabilities Example > Suppose X is normal with mean 8.0 and standard deviation 5.0 >Now Find P(X>8.6) ●Greater than X ●At least X ●More than X ●Not less than X Normal.xls 8.0 8.6 Statistics for Managers Using Microsoft Excel Chap 6-27
Statistics for Managers Using Microsoft Excel Chap 6-27 Finding Upper Tail Probabilities Example Suppose X is normal with mean 8.0 and standard deviation 5.0. Now Find P(X > 8.6) Greater than X At least X More than X Not less than X X 8.0 8.6 Normal.xls
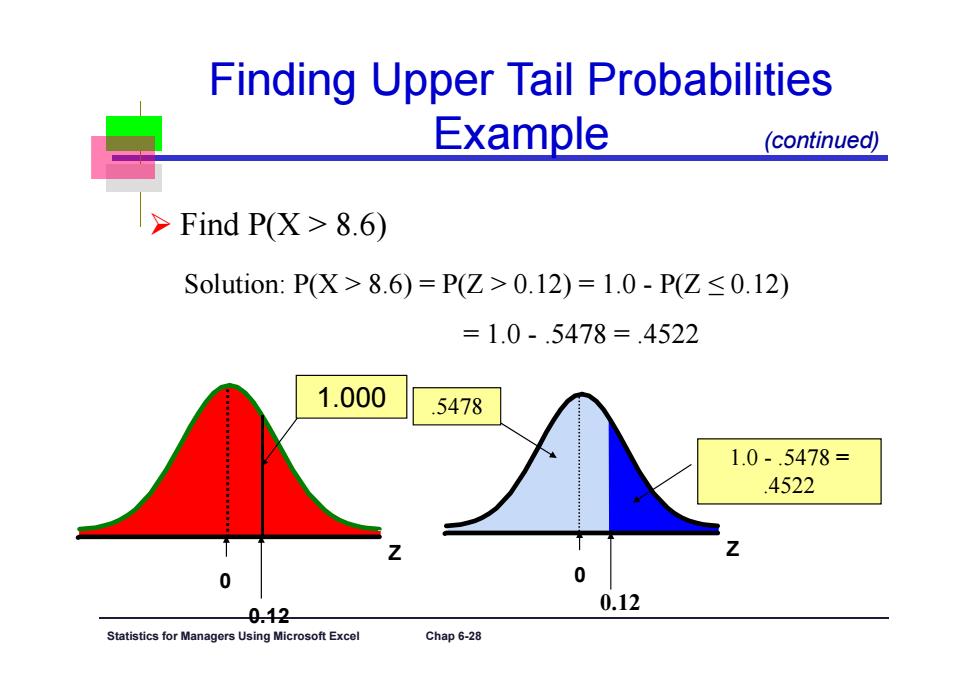
Finding Upper Tail Probabilities Example (continued) Find P(X>8.6) Solution:P(X>8.6)=P(Z>0.12)=1.0-P(Z≤0.12) =1.0-.5478=.4522 1.000 5478 1.0-.5478= 4522 0 0 0.12 0.12 Statistics for Managers Using Microsoft Excel Chap 6-28
Statistics for Managers Using Microsoft Excel Chap 6-28 Z 0.12 0 .5478 1.0 - .5478 = .4522 Z 0.12 0 1.000 Finding Upper Tail Probabilities Example Find P(X > 8.6) Solution: P(X > 8.6) = P(Z > 0.12) = 1.0 - P(Z ≤ 0.12) = 1.0 - .5478 = .4522 (continued)

General Procedure for Finding Normal Probability Procedure To find P(a<X<b)when X is distributed normally: > Draw the normal curve for the problem in terms of X. Translate X-values to Z-values. Use the Standardized Normal Table. Statistics for Managers Using Microsoft Excel Chap 6-29
Statistics for Managers Using Microsoft Excel Chap 6-29 General Procedure for Finding Normal Probability Procedure Draw the normal curve for the problem in terms of X. Translate X-values to Z-values. Use the Standardized Normal Table. To find P (a < X < b) when X is distributed normally:
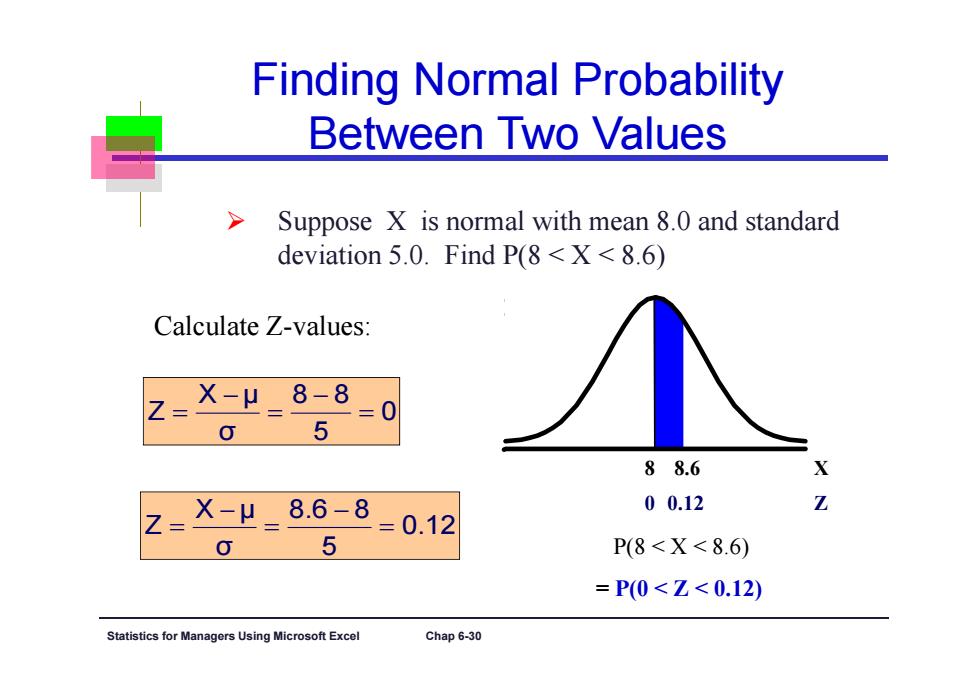
Finding Normal Probability Between Two Values Suppose X is normal with mean 8.0 and standard deviation 5.0.Find P(8<X<8.6) Calculate Z-values: z= X-μ8-8 三0】 0 5 88.6 X X-μ8.6-8 5 =0.12 00.12 P(8<X<8.6) =P0<Z<0.12) Statistics for Managers Using Microsoft Excel Chap 6-30
Statistics for Managers Using Microsoft Excel Chap 6-30 Finding Normal Probability Between Two Values Suppose X is normal with mean 8.0 and standard deviation 5.0. Find P(8 < X < 8.6) P(8 < X < 8.6) = P(0 < Z < 0.12) 0 5 8 8 σ X μ Z 0.12 5 8.6 8 σ X μ Z Calculate Z-values: 0 0.12 Z 8 8.6 X