3)正弦信号 正弦信号定义: x(t)=Asin(ot+o) ■4)指数信号 ■指数信号的定义: x(t)=Ae(atoi) 如果o=0,则为实指数函数;如果a=0,则为虚 指数函数。 ·指数函数的表示,即用模和相角或者采用实部和 虚部来表示指数信号随时间变化的规律
3)正弦信号 n 正弦信号定义: n 4)指数信号 n 指数信号的定义: n 如果 ,则为实指数函数;如果a=0,则为虚 指数函数。 n 指数函数的表示,即用模和相角或者采用实部和 虚部来表示指数信号随时间变化的规律。 x(t) = + A t sin( ) w j ( ) ( ) a j t x t Ae +w = w = 0
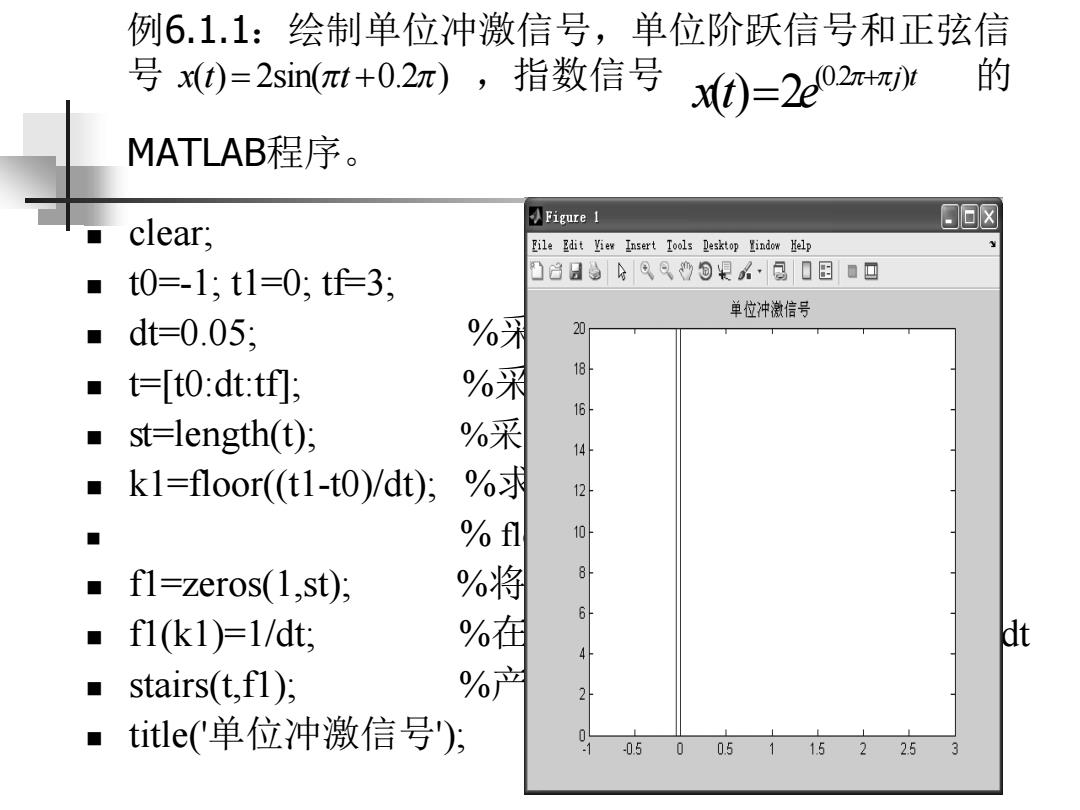
例6.1.1:绘制单位冲激信号,单位阶跃信号和正弦信 号x(t)=2sin(πt+0.2m),指数信 号0)=2e02r+ t的 MATLAB程序。 Figure 1 clear; 日▣☒ File Edit View Insert Tools Desktop Yindow Help ■t0=-1;t1=0;tf=3; 凸日分6999包根公,圆0国■回 单位冲激信号 ■dt=0.05: %乳 20 ■t=[t0:dt:tf]; %采 18 16 ■ st=length(t); %采 14 k1=floor((t1-to)/dt); %求 12 ■ %f1 10 fl=zeros(1,st); %将 8 ■f1(k1)=1/dt: %在 dt ■ stairs(t,fl); %产 ■title(单位冲激信号); -0.5 0 0.51 152 253
例6.1.1:绘制单位冲激信号,单位阶跃信号和正弦信 号 ,指数信号 的 MATLAB程序。 n clear; n t0=-1; t1=0; tf=3; n dt=0.05; %采样间隔 n t=[t0:dt:tf]; %采样点向量 n st=length(t); %采样点向量长度 n k1=floor((t1-t0)/dt); %求t1时刻对应的样本序号 n % floor的功能是“下取整” n f1=zeros(1,st); %将全部信号初始化为零 n f1(k1)=1/dt; %在时间t=t1处,给样本赋值为1/dt n stairs(t,f1); %产生单位冲激信号 n title('单位冲激信号'); x(t t )= + 2sin(p p 0.2 ) (0.2 ) () 2 j t x t e p p+ =
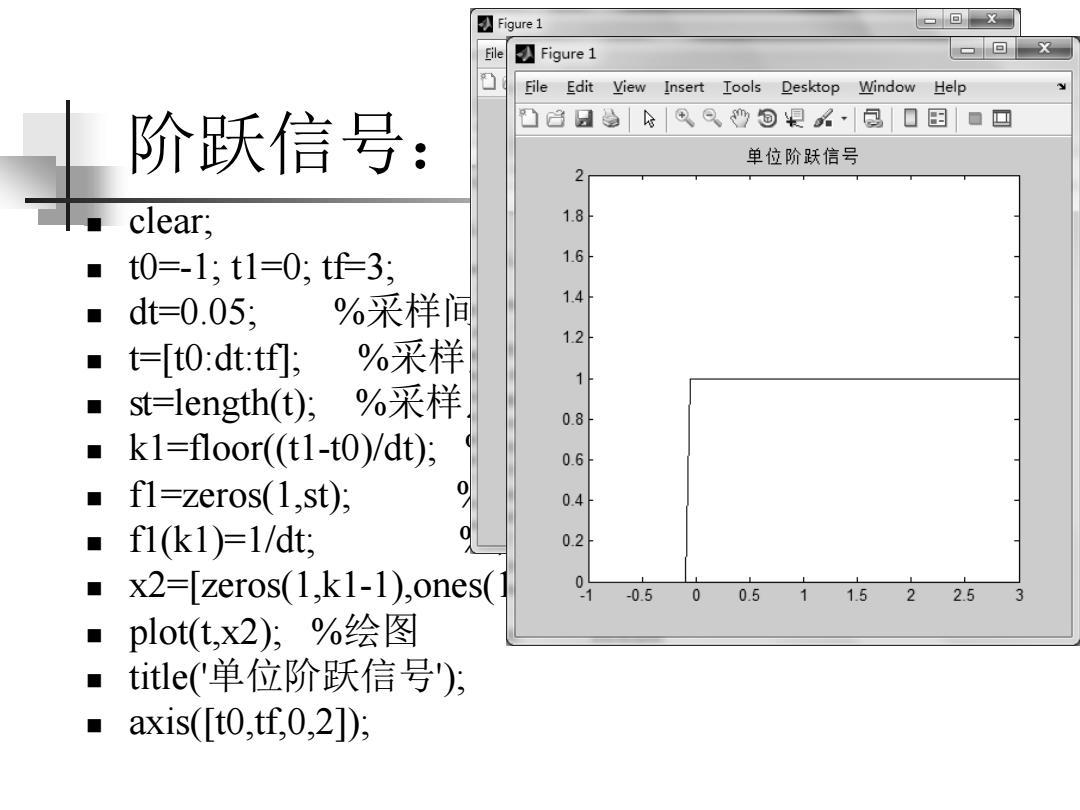
☑Figure1 回X Eile ☑Figure1 ▣回 X File Edit View Insert Tools Desktop Window Help 阶跃信号: 单位阶跃信号 2 clear, 1.8 t0=-1,t1=0:tf=3: 1.6 ▣dt=0.05; %采样间 14 %采样 1.2 ■ t=[to:dt:tf]; 1 ■ st=length(t),%采样 0.8 ■ k1=floor((t1-t0)/dt); 0.6 ■ fl=zeros(1,st); 0.4 ■ f1(k1)=1/dt, 0 0.2 a x2=[zeros(1,k1-1),ones( 0 -0.500.511.522.5 plot(t,x2);%绘图 title(单位阶跃信号); ■axis([t0,tf,0,2]):
阶跃信号: n clear; n t0=-1; t1=0; tf=3; n dt=0.05; %采样间隔 n t=[t0:dt:tf]; %采样点向量 n st=length(t); %采样点向量长度 n k1=floor((t1-t0)/dt); %求t1时刻对应的样本序号 n f1=zeros(1,st); %将全部信号初始化为零 n f1(k1)=1/dt; %在时间t=t1处,给样本赋值为1/dt n x2=[zeros(1,k1-1),ones(1,st-k1+1)]; %产生阶跃信号 n plot(t,x2); %绘图 n title('单位阶跃信号'); n axis([t0,tf,0,2]);
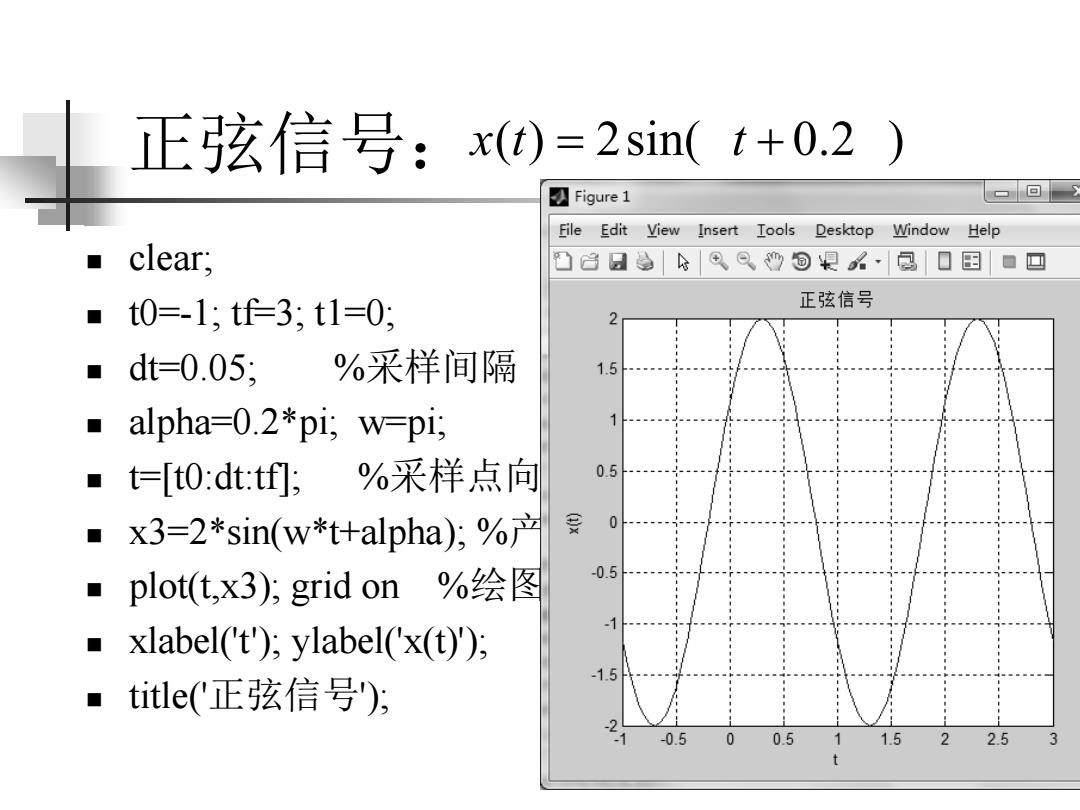
正弦信号:x(t)=2sin(t+0.2) ☑Figure1 ▣回 File Edit View Insert Tools Desktop Window Help clear; 凸3日®⑨沙回早公,同|口图■回 ▣t0=-1:tf=3:t1=0: 正弦信号 ■dt=0.05; %采样间隔 1.5 ■alpha-=O.2*pi;w=pi, ■1 =[t0:dt:tf;%采样点向 0.5 ■ x3=2*sin(w*t+alpha);% -0.5 ■ plot(t,.x3);grid on%绘图 ■ xlabel('t');ylabel('x(t)); 1.5 title('正弦信号'); -0.5 0.511.5 2 2.5
正弦信号: n clear; n t0=-1; tf=3; t1=0; n dt=0.05; %采样间隔 n alpha=0.2*pi; w=pi; n t=[t0:dt:tf]; %采样点向量 n x3=2*sin(w*t+alpha); %产生正弦信号 n plot(t,x3); grid on %绘图 n xlabel('t'); ylabel('x(t)'); n title('正弦信号'); x(t t ) = + 2sin(p p 0.2 )
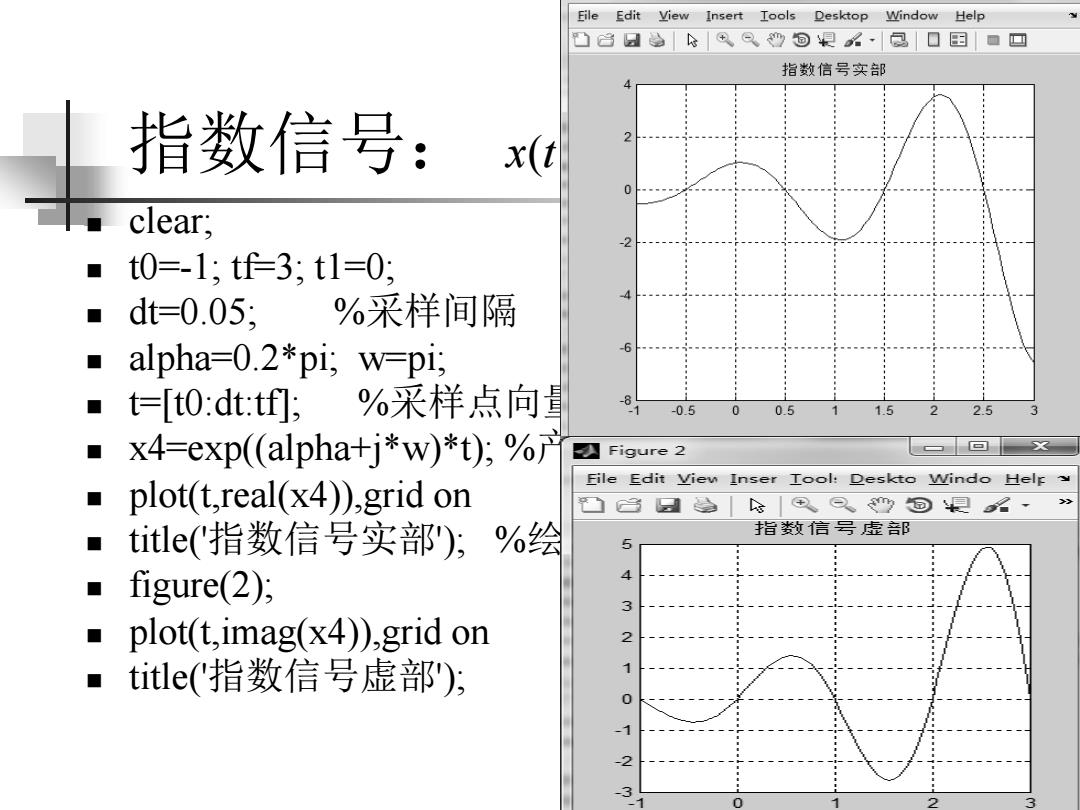
Eile Edit View Insert Iools Desktop Window Help 凸3日多⊕⊙回貝公·凤口田■▣ 指数信号实部 指数信号:xt clear; ■t0=-1:tf3:t1=0: ■dt=0.05; %采样间隔 ■ alpha=0.2*pi;w=pi; ■1 =[t0:dt:tf;%采样点向直 0.5 0 x4-exp((alpha+j*w)*t);% Figure 2 File Edit View Inser Tool:Deskto Windo Help plot(t,real(x4)),grid on title(指数信号实部);%绘 指数信号虚部 5 ·figure(2); 4 3 ■ plot(t,imag(x4)),grid on ■ title(指数信号虚部); 0 -2 3
指数信号: n clear; n t0=-1; tf=3; t1=0; n dt=0.05; %采样间隔 n alpha=0.2*pi; w=pi; n t=[t0:dt:tf]; %采样点向量 n x4=exp((alpha+j*w)*t); %产生指数信号 n plot(t,real(x4)),grid on n title('指数信号实部'); %绘图 n figure(2); n plot(t,imag(x4)),grid on n title('指数信号虚部'); (0.2 ) ( ) 2 j t x t e p p+ =