MATLAB 应用与实验教程 About HATLAB ◆MATLAB: MATLAB ◆MATrix LABoratory The Language of Technical Computing Version 7.1.0.246(R14)Service Pack 3 August 02,2005 ◆1980年前后,C1 eve Mo1er教 License Number.161051 授编写的Linpack和Eispack的 接口程序。 ◆高级语言两种工作方式 ◆解释和编译
1 MATLAB 应用与实验教程 MATLAB: MATrix LABoratory 1980年前后,Cleve Moler教 授编写的Linpack 和Eispack的 接口程序。 高级语言两种工作方式 解释和编译

基于Matlab的牛顿环干涉条纹的模拟 axis square; shading interp 牛顿环是由于光的等厚干涉而产生的,是一些 figure(3) 明暗相间的同心圆环。牛顿环可以用来测量透镜的 x=-4:0.05: 曲率半径,在加工光学零件时用于检查平面或曲面 Il =4 *cos(pi/Length *((x.2)/R+Length/2)).2 的面型准确度,在实际中有重要意义。 plot(x I1 :K) 如图1所示,在一块平板玻璃与一块曲率半径 运行程序后可得模拟结果,如图2所示。 很大的凸透镜之间就形成一层厚度由中心接触点向 外渐增的空气膜,当以平行单色光垂直入射时,入射 3001 光在空气膜上、下两表面发生反射,形成两束相干 200 100 光。分析可知,其光程差为 0 δ=2/R+入/2 式中r为空气膜等厚线的半径,光强分布为 1=416cos (a)牛顿环三维分布 250 3 200 21 150 0 100 2 50 .3 图1牛顿环装置 4-3-2-101234 43210 (b)牛顿环投艺分行 Fig.1 A setup to observe Newton s rings (c)轴线光强分布 在Matlab软件中输入以下程序 图2牛顿环分布图及轴线光强分布 教学网站:mata6.ctu.cn 2
教学网站: matlab.lctu.cn 2
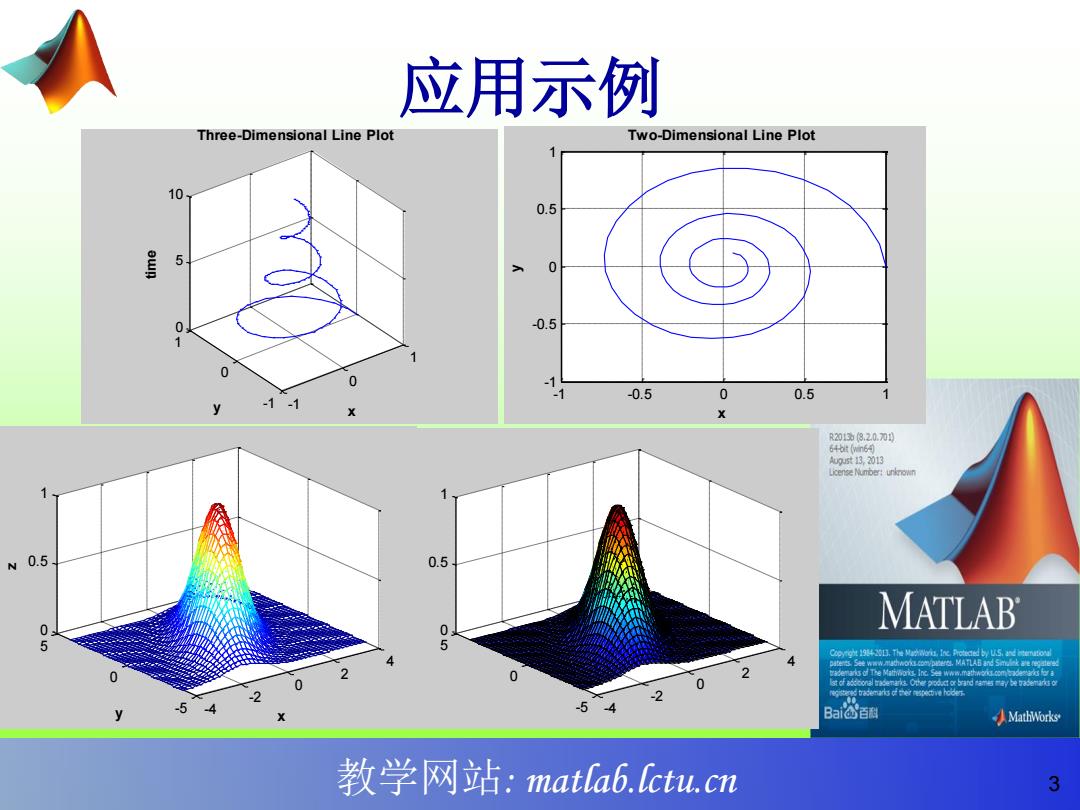
应用示例 Three-Dimensional Line Plot Two-Dimensional Line Plot 0.5 5 0 0 -0.5 1 0 0 -1 -1 -0.5 0 0.5 1 R201为820.刀0 66出m6约 U0时13,2013 License Number:uninown N 0.5 0.5 0 MATLAB 0 5 Cooyriont 1984201.The Machivoris.Ine Proticted by US,and lteritonl MAA 0 2 0 -5 d -54 Bai百利 ◆Mathw6brks 教学网站:mata6.ctu,cn 3
教学网站: matlab.lctu.cn 3 应用示例 -4 -2 0 2 4 -5 0 5 0 0.5 1 -4 -2 0 2 4 -5 0 5 0 0.5 1 y x z -1 0 1 -1 0 1 0 5 10 x Three-Dimensional Line Plot y time -1 -0.5 0 0.5 1 -1 -0.5 0 0.5 1 Two-Dimensional Line Plot x y
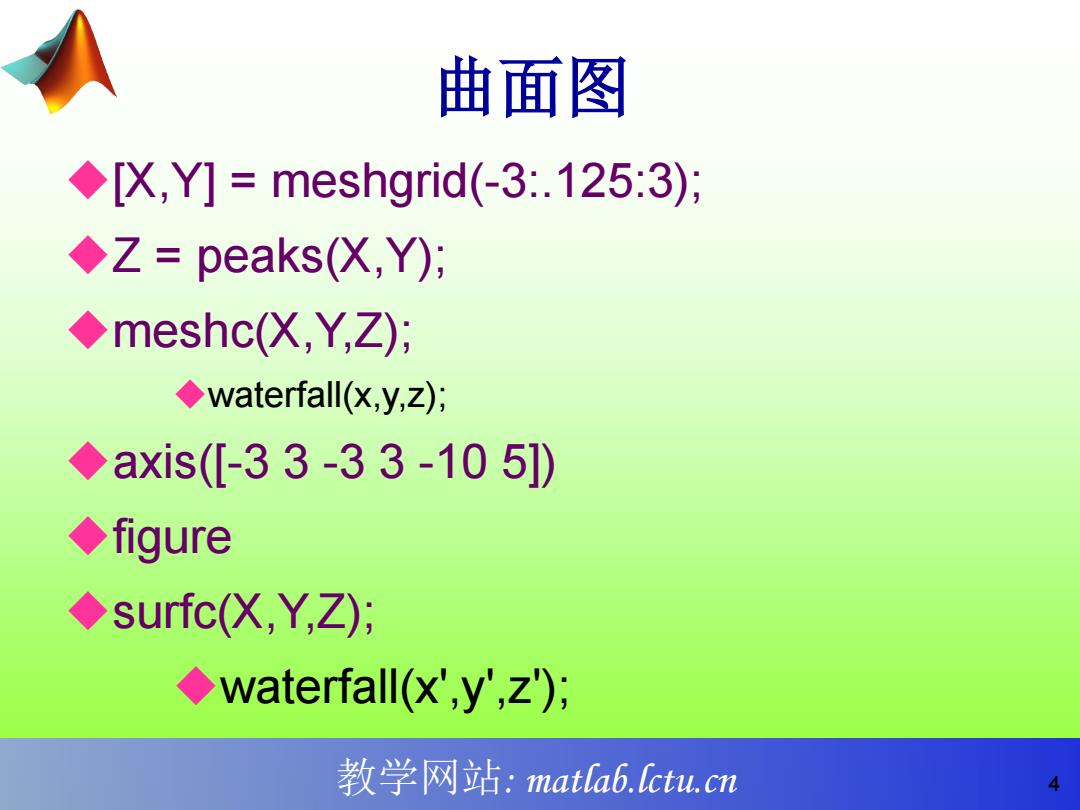
曲面图 [X,Y]meshgrid(-3:.125:3); ◆Z=peaks(X,Y); ◆meshc(X,Y,Z); ◆waterfall(x,y,z); ◆axis(-33-33-105]) ◆figure ◆surfc(X,Y,Z); waterfall(x',y',z); 教学网站:mata6.fctu.cn
教学网站: matlab.lctu.cn 4 曲面图 [X,Y] = meshgrid(-3:.125:3); Z = peaks(X,Y); meshc(X,Y,Z); waterfall(x,y,z); axis([-3 3 -3 3 -10 5]) figure surfc(X,Y,Z); waterfall(x',y',z');

5 10 0 .5 5 0 2 10 2 3 图3.17 函数peaks的具有等高线的三 维网格线图 图3.18函数peaks的具有等高线 的网状表面图 教学网站:mata6.fctu,cn 5
教学网站: matlab.lctu.cn 5 -3 -2 -1 0 1 2 3 -2 0 2 -10 -5 0 5 图3.17 函数peaks的具有等高线的三 维网格线图 -4 -2 0 2 4 -4 -2 0 2 4 -10 -5 0 5 10 图3.18 函数peaks的具有等高线 的网状表面图