
Example:Happy Bulls and Worried Bears Are you a worried bear that believes that the economy is 区 sinking?NOT TO WORRY!With EndRun's Worried Bear Fund,you can get a four hundred percent rate of return in times of recession! Are you a Happy Bull that believes that the economy will be rebounding?GET EVEN HAPPIER!With EndRun's Happy Bear Fund,you can make twelve times your initial investment (that's a 1200 percent rate of return!)in a fast expanding,booming economy. Happy Bull or Worried Bear--either way you can make money as an analysis shows that both funds have a positive expected value--that statistical talk for"you cannot lose!" Chap 5-16 Tongji University School of Economics Management Statistics for Managers Using Microsoft Excel
Statistics for Managers Using Microsoft Excel Chap 5-16 Tongji University School of Economics & Management Example: Happy Bulls and Worried Bears ▪ Are you a worried bear that believes that the economy is sinking? NOT TO WORRY! With EndRun's Worried Bear Fund, you can get a four hundred percent rate of return in times of recession! ▪ Are you a Happy Bull that believes that the economy will be rebounding? GET EVEN HAPPIER! With EndRun's Happy Bear Fund, you can make twelve times your initial investment (that's a 1200 percent rate of return!) in a fast expanding, booming economy. ▪ Happy Bull or Worried Bear--either way you can make money as an analysis shows that both funds have a positive expected value--that statistical talk for "you cannot lose!

Happy Worried Outcomes P Bull Bear fast expanding economy 0.1 1200 -300 expanding economy 0.2 600 -200 stable economy 0.5 -100 100 recession 0.2 -900 400 portfolio expected return and risk.xls>sheet2 Computing the Mean,Standard Deviation for fund returns of Happy Bull and Worried Bear, computing the covariance for fund returns,and interpreting the results
Outcomes P Happy Bull Worried Bear fast expanding economy 0.1 1200 -300 expanding economy 0.2 600 -200 stable economy 0.5 -100 100 recession 0.2 -900 400 Computing the Mean, Standard Deviation for fund returns of Happy Bull and Worried Bear, computing the covariance for fund returns, and interpreting the results portfolio expected return and risk.xls→sheet2

Portfolio Expected Return and Portfolio Risk Portfolio expected return (weighted average return): E(P)=wE(X)+(1-w)E(Y) Portfolio risk (weighted variability) Op =/w2ox+(1-w)2o+2w(1-w)oxx Where w=portion of portfolio value in asset X (1-w)=portion of portfolio value in asset Y Chap 5-18 Tongji University School of Economics Management Statistics for Managers Using Microsoft Excel
Statistics for Managers Using Microsoft Excel Chap 5-18 Tongji University School of Economics & Management Portfolio Expected Return and Portfolio Risk ▪ Portfolio expected return (weighted average return): ▪ Portfolio risk (weighted variability) Where w = portion of portfolio value in asset X (1 - w) = portion of portfolio value in asset Y E(P) = wE(X) + (1− w)E(Y) XY 2 Y 2 2 X 2 σP = w σ + (1− w) σ + 2w(1- w)σ
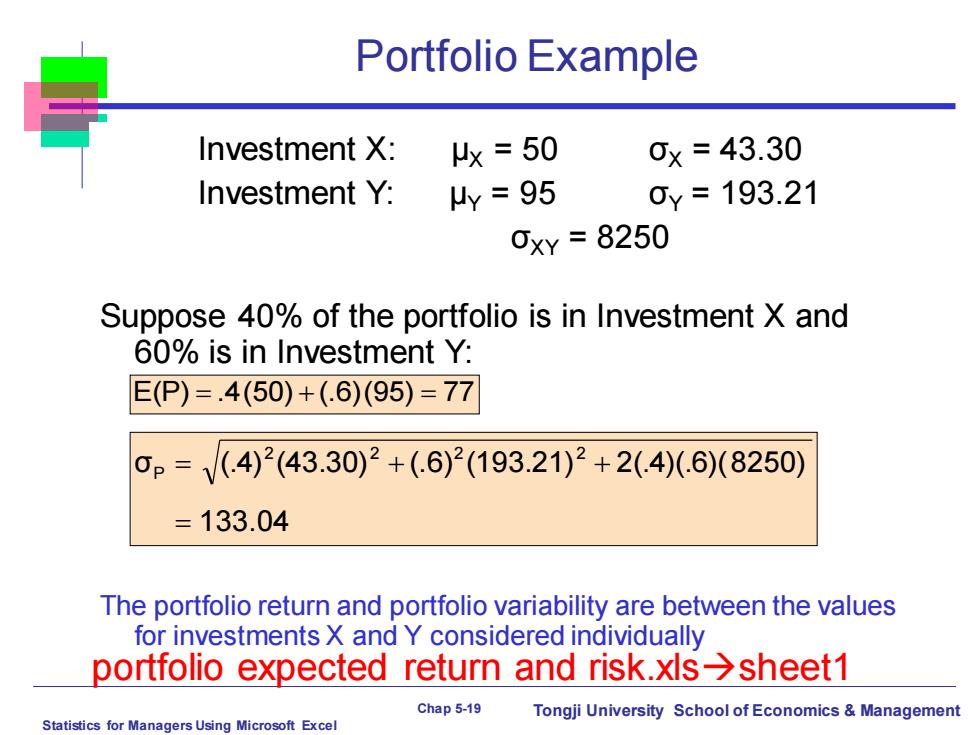
Portfolio Example Investment X: x=50 0×=43.30 Investment Y: uy=95 0y=193.21 0xY=8250 Suppose 40%of the portfolio is in Investment X and 60%is in Investment Y: E(P)=.4(50)+(.6)(95)=77 0p=V(.4)2(43.30)2+(6)2(193.21)2+2(.4)(.6(8250) =133.04 The portfolio return and portfolio variability are between the values for investments X and Y considered individually portfolio expected return and risk.xls>sheet1 Chap5-19 Tongji University School of Economics Management Statistics for Managers Using Microsoft Excel
Statistics for Managers Using Microsoft Excel Chap 5-19 Tongji University School of Economics & Management Portfolio Example Investment X: μX = 50 σX = 43.30 Investment Y: μY = 95 σY = 193.21 σXY = 8250 Suppose 40% of the portfolio is in Investment X and 60% is in Investment Y: The portfolio return and portfolio variability are between the values for investments X and Y considered individually E(P) = .4(50) + (.6)(95) = 77 133.04 σ (.4) (43.30) (.6) (193.21) 2(.4)(.6)(8250) 2 2 2 2 P = = + + portfolio expected return and risk.xls→sheet1

Probability Distributions Probability Distributions Ch.5 Discrete Continuous Ch.6 Probability Probability Distributions Distributions Binomial Normal Hypergeometric Uniform Poisson Exponential Chap 5-20 Tongji University School of Economics Management Statistics for Managers Using Microsoft Excel
Statistics for Managers Using Microsoft Excel Chap 5-20 Tongji University School of Economics & Management Probability Distributions Continuous Probability Distributions Binomial Hypergeometric Poisson Probability Distributions Discrete Probability Distributions Normal Uniform Exponential Ch. 5 Ch. 6