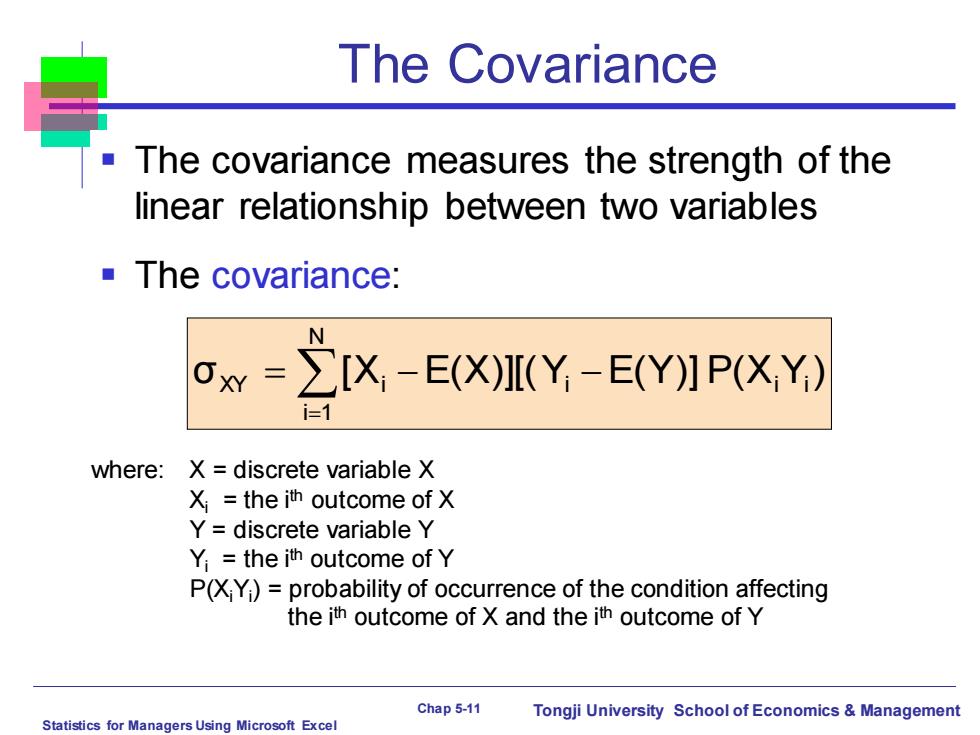
The Covariance The covariance measures the strength of the linear relationship between two variables ■The covariance: ∑[X-E (X)(Y-E(Y)]P(X,Y) i= where: X discrete variable X Xi=the ith outcome of X Y=discrete variable Y Yi=the ith outcome of Y P(XiYi)=probability of occurrence of the condition affecting the ith outcome of X and the ith outcome of Y Chap 5-11 Tongji University School of Economics Management Statistics for Managers Using Microsoft Excel
Statistics for Managers Using Microsoft Excel Chap 5-11 Tongji University School of Economics & Management The Covariance ▪ The covariance measures the strength of the linear relationship between two variables ▪ The covariance: σ [X E(X)][(Y E(Y)] P(X Y) N i 1 XY i i i i = = − − where: X = discrete variable X Xi = the ith outcome of X Y = discrete variable Y Yi = the ith outcome of Y P(XiYi ) = probability of occurrence of the condition affecting the ith outcome of X and the ith outcome of Y

Computing the Mean for Investment Returns Return per $1,000 for two types of investments Investment P(XY) Economic condition Passive Fund X Aggressive Fund Y .2 Recession -$25 -$200 .5 Stable Economy +50 +60 .3 Expanding Economy +100 +350 E(X)=μx=(←25)(.2)+(50)(.5)+(100)(.3)=50 E(Y)=y=(-200)(.2)+(60)(.5)+(350)(.3)=95 Chap 5-12 Tongji University School of Economics Management Statistics for Managers Using Microsoft Excel
Statistics for Managers Using Microsoft Excel Chap 5-12 Tongji University School of Economics & Management Computing the Mean for Investment Returns Return per $1,000 for two types of investments P(XiYi ) Economic condition Passive Fund X Aggressive Fund Y .2 Recession - $ 25 - $200 .5 Stable Economy + 50 + 60 .3 Expanding Economy + 100 + 350 Investment E(X) = μX = (-25)(.2) +(50)(.5) + (100)(.3) = 50 E(Y) = μY = (-200)(.2) +(60)(.5) + (350)(.3) = 95
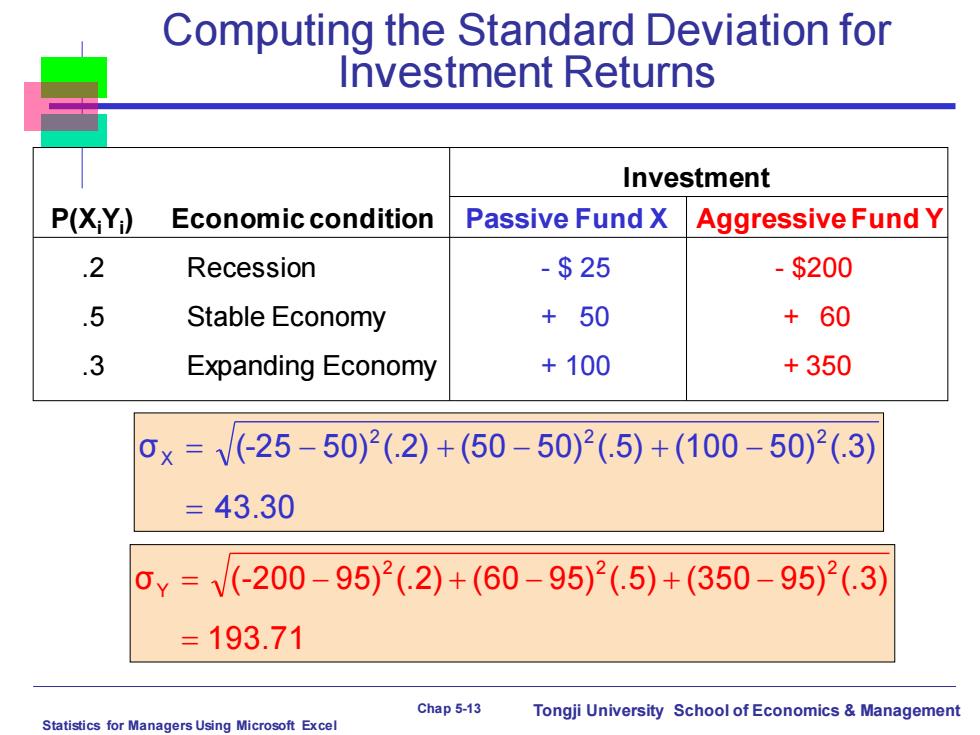
Computing the Standard Deviation for Investment Returns Investment P(XY) Economic condition Passive Fund X Aggressive Fund Y .2 Recession -$25 -$200 .5 Stable Economy +50 +60 .3 Expanding Economy +100 +350 0x=V(-25-50)2(.2)+(50-50)2(.5)+(100-50)2(.3) =43.30 0¥=V(-200-95)2(.2)+(60-95)2(.5)+(350-95)2(.3) =193.71 Chap 5-13 Tongji University School of Economics Management Statistics for Managers Using Microsoft Excel
Statistics for Managers Using Microsoft Excel Chap 5-13 Tongji University School of Economics & Management Computing the Standard Deviation for Investment Returns P(XiYi ) Economic condition Passive Fund X Aggressive Fund Y .2 Recession - $ 25 - $200 .5 Stable Economy + 50 + 60 .3 Expanding Economy + 100 + 350 Investment 43.30 σ (-25 50) (.2) (50 50) (.5) (100 50) (.3) 2 2 2 X = = − + − + − 193.7 1 σ (-200 9 5) (.2) (6 0 9 5) (.5) (350 9 5) (.3) 2 2 2 Y = = − + − + −

Computing the Covariance for Investment Returns Ox=∑[X,-E(X)I(Y,-E(Y】P(XY) i✉1 Investment P(XY) Economic condition Passive Fund X Aggressive Fund Y .2 Recession -$25 -$200 .5 Stable Economy +50 +60 .3 Expanding Economy +100 +350 0x¥=(-25-50)(200-95)(.2)+(50-50)(60-95)(.5) +(100-50)350-95)(.3) =8250 Chap 5-14 Tongji University School of Economics Management Statistics for Managers Using Microsoft Excel
Statistics for Managers Using Microsoft Excel Chap 5-14 Tongji University School of Economics & Management Computing the Covariance for Investment Returns P(XiYi ) Economic condition Passive Fund X Aggressive Fund Y .2 Recession - $ 25 - $200 .5 Stable Economy + 50 + 60 .3 Expanding Economy + 100 + 350 Investment 8250 (100 50)(350 95)(.3) σ (-25 50)(-200 95)(.2) (50 50)(60 95)(.5) X,Y = + − − = − − + − − σ [X E(X)][(Y E(Y)] P(X Y) N i 1 XY i i i i = = − −
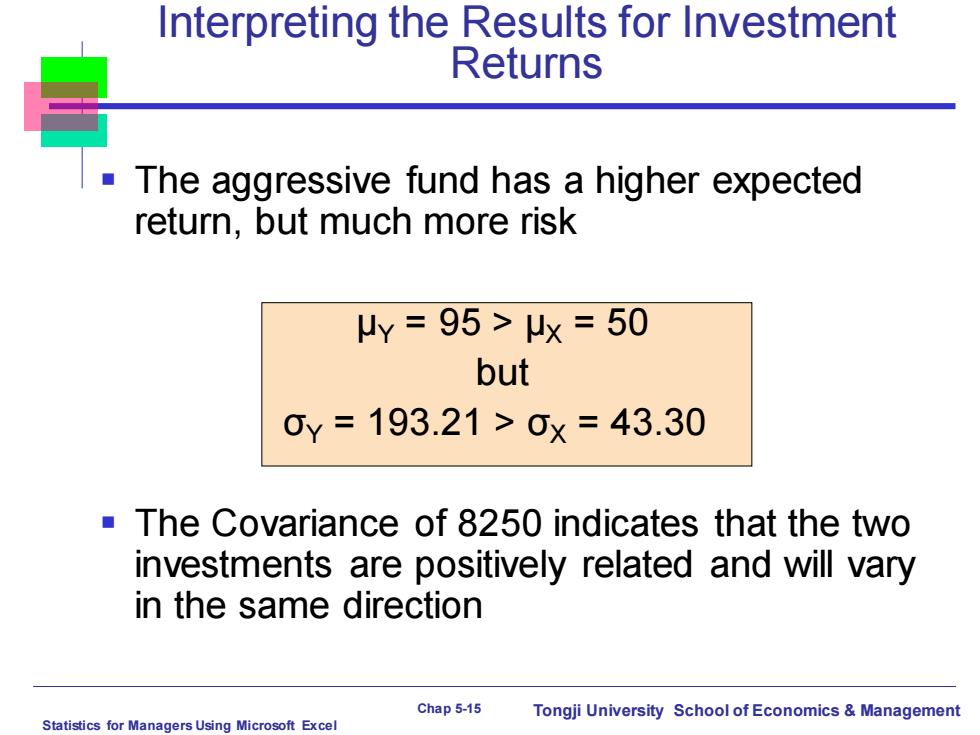
Interpreting the Results for Investment Returns The aggressive fund has a higher expected return,but much more risk μy=95>μx=50 but 0y=193.21>0×=43.30 The Covariance of 8250 indicates that the two investments are positively related and will vary in the same direction Chap 5-15 Tongji University School of Economics Management Statistics for Managers Using Microsoft Excel
Statistics for Managers Using Microsoft Excel Chap 5-15 Tongji University School of Economics & Management ▪ The aggressive fund has a higher expected return, but much more risk μY = 95 > μX = 50 but σY = 193.21 > σX = 43.30 ▪ The Covariance of 8250 indicates that the two investments are positively related and will vary in the same direction Interpreting the Results for Investment Returns