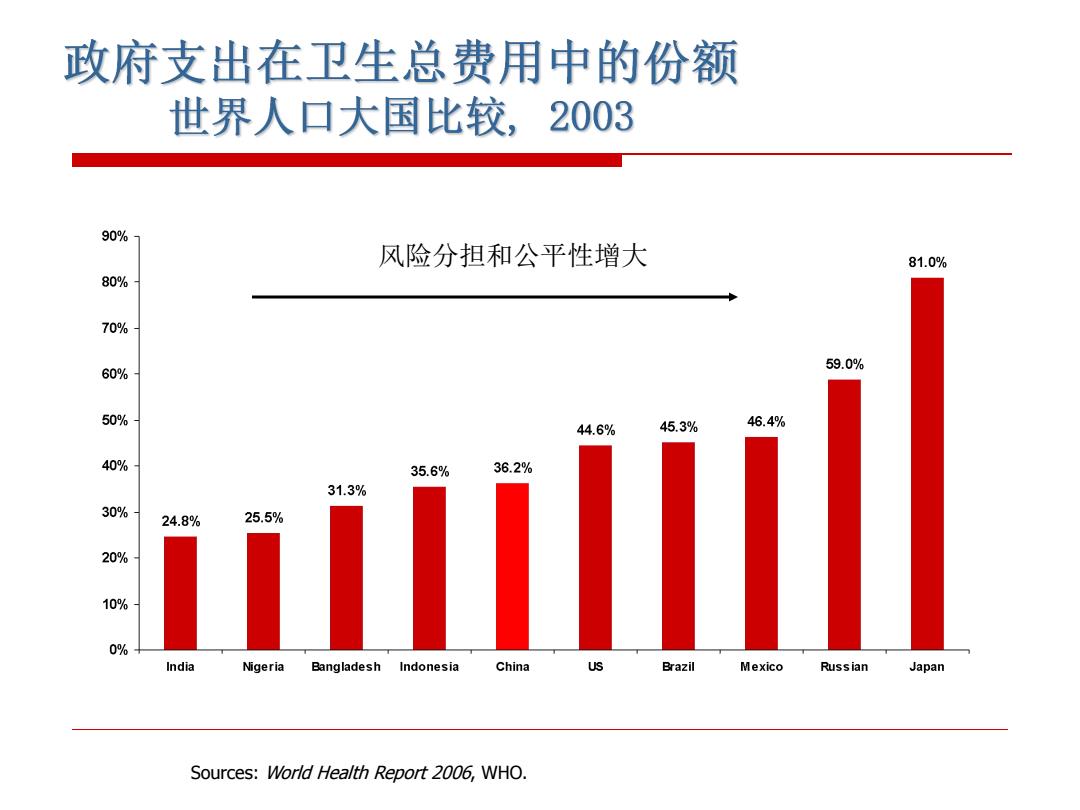
政府支出在卫生总费用中的份额 世界人口大国比较,2003 90%1 风险分担和公平性增大 81.0% 80% 70% 59.0% 60% 50% 44.6% 45.3% 46.4% 40% 35.6% 36.2% 31.3% 30% 24.8% 25.5% 20% 10% 0% India Nigeria Bangladesh Indonesia China US Brazil Mexico Russian Japan Sources:World Health Report 2006,WHO
Sources: World Health Report 2006, WHO. 风险分担和公平性增大
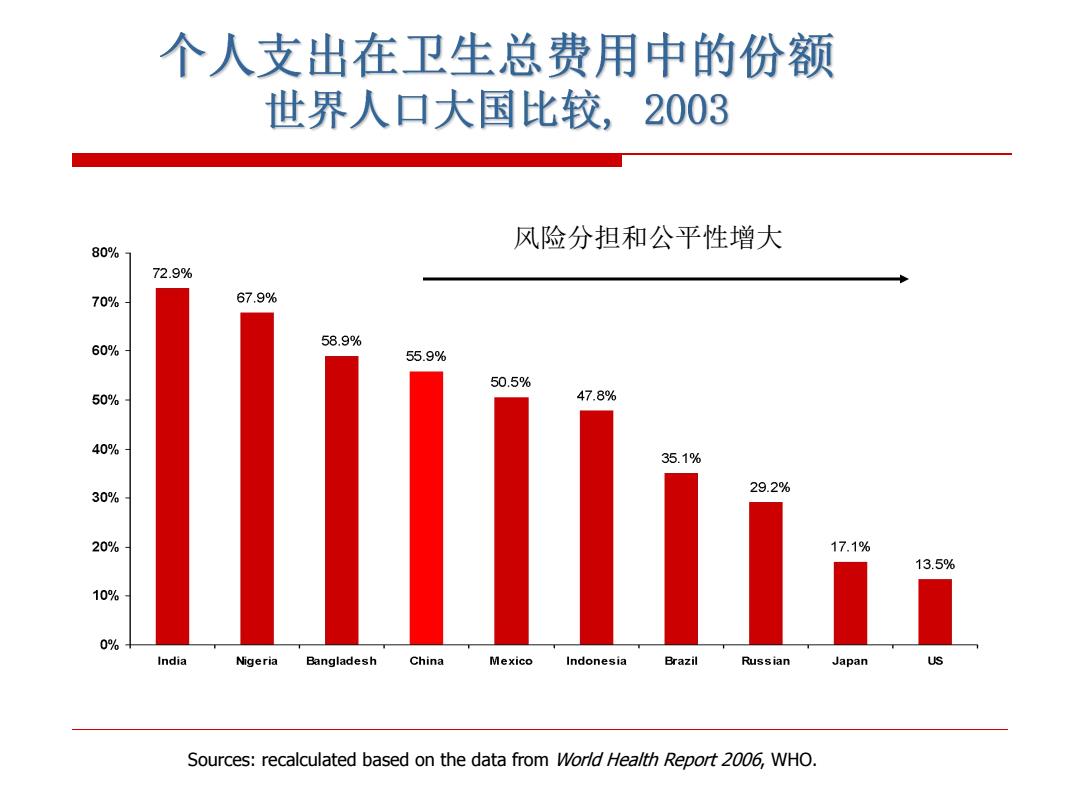
个人支出在卫生总费用中的份额 世界人口大国比较, 2003 风险分担和公平性增大 80% 72.9% 70% 67.9% 58.9% 60% 55.9% 50.5% 50% 47.8% 40% 35.1% 29.2% 30% 20% 17.1% 13.5% 10% 0% India Nigeria Bangladesh China Mexico Indonesia Brazil Russian Japan US Sources:recalculated based on the data from World Hea/th Report 2006,WHO
Sources: recalculated based on the data from World Health Report 2006, WHO. 风险分担和公平性增大
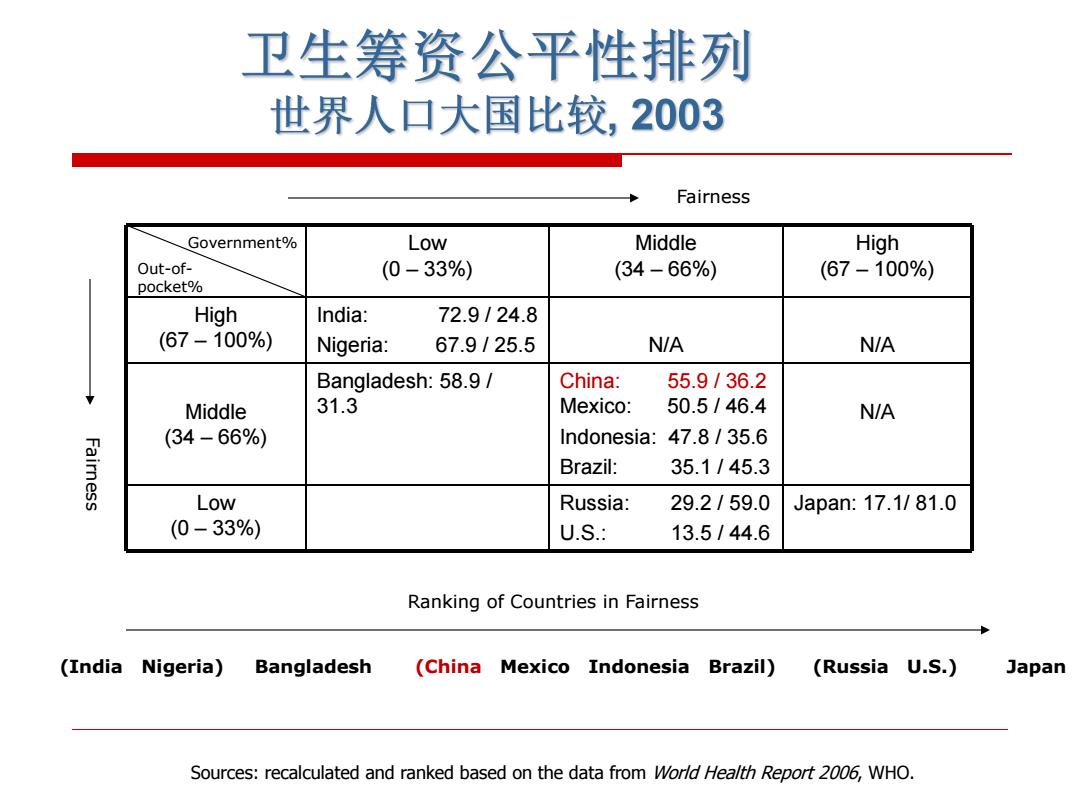
卫生筹资公平性排列 世界人口大国比较,2003 Fairness Government% Low Middle High Out-of- (0-33%) (34-66%) (67-100%) pocket% High India: 72.9124.8 (67-100%) Nigeria: 67.9125.5 N/A N/A Bangladesh:58.9/ China: 55.9136.2 Middle 31.3 Mexico: 50.5/46.4 N/A (34-66%) Indonesia:47.8/35.6 Brazil: 35.1/45.3 Low Russia: 29.2/59.0 Japan:17.1/81.0 (0-33%) U.S.: 13.5/44.6 Ranking of Countries in Fairness (India Nigeria) Bangladesh (China Mexico Indonesia Brazil) (Russia U.S.) Japan Sources:recalculated and ranked based on the data from World Hea/th Report 2006,WHO
Low (0 – 33%) Middle (34 – 66%) High (67 – 100%) High (67 – 100%) India: 72.9 / 24.8 Nigeria: 67.9 / 25.5 N/A N/A Middle (34 – 66%) Bangladesh: 58.9 / 31.3 China: 55.9 / 36.2 Mexico: 50.5 / 46.4 Indonesia: 47.8 / 35.6 Brazil: 35.1 / 45.3 N/A Low (0 – 33%) Russia: 29.2 / 59.0 U.S.: 13.5 / 44.6 Japan: 17.1/ 81.0 F airn e s s Fairness Government% Out-of- pocket% (India Nigeria) Bangladesh (China Mexico Indonesia Brazil) (Russia U.S.) Japan Ranking of Countries in Fairness Sources: recalculated and ranked based on the data from World Health Report 2006, WHO
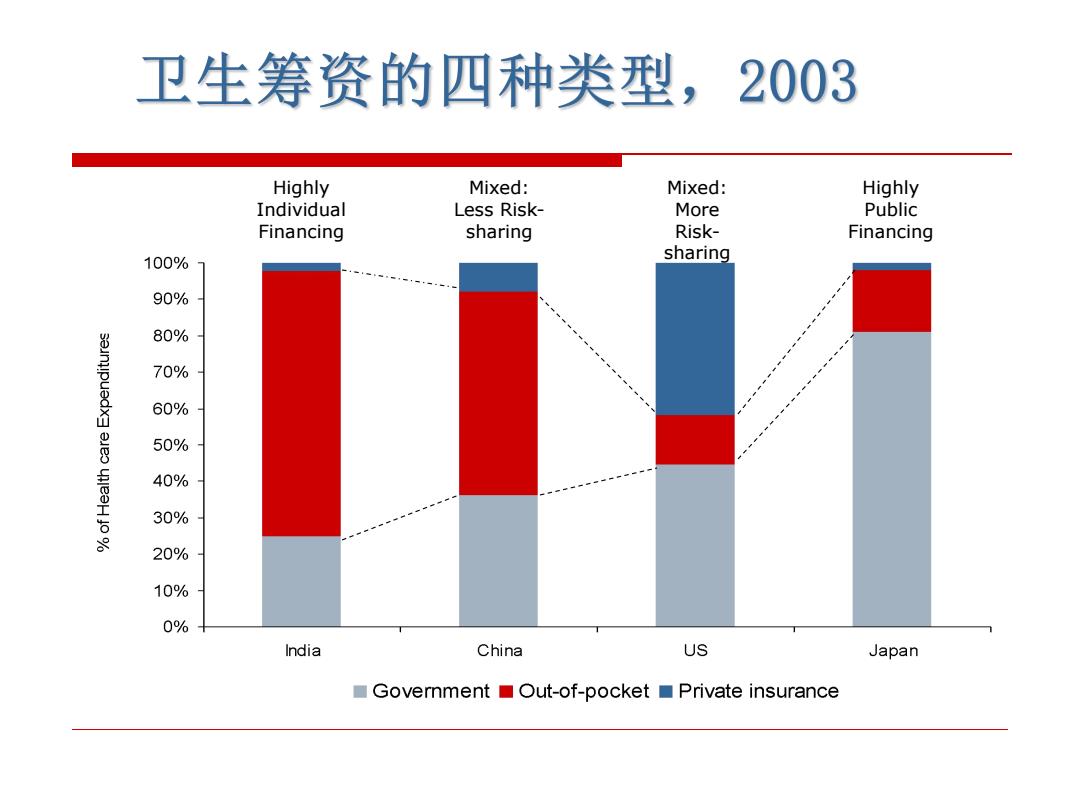
卫生筹资的四种类型,2003 Highly Mixed: Mixed: Highly Individual Less Risk- More Public Financing sharing Risk- Financing 100% sharing 90% 80% 70% 60% aleo 50% 40% 30% 20% 10% 0% India China US Japan ■Government■Out-of-pocket■Private insurance
Highly Individual Financing Highly Public Financing Mixed: Less Risk- sharing Mixed: More Risk- sharing

改革以来中国城乡居民家庭支出构成的变化 (1985-2011) 100% 90% 80% 食品52%-40% 70% 64% 60% 72/% 衣着15%-10% 50% 40% 居住5%-10% 30% 交通通讯 2-10% 20% 娱乐教育文化8%-14% 医疗保健3%-8% 10% 其他支出16%-9% 0% 1985 19901995 2000 20022003 2004 2005 2006 20072008 20092010 2011 数据来源:中华人民共和国卫生部:《2011中国卫生统计年鉴》
食品 52%–40% 衣着 15%–10% 居住 5%-10% 交通通讯 2-10% 娱乐教育文化 8%–14% 医疗保健 3%-8% 其他支出 16%-9% 64% 72% 数据来源:中华人民共和国卫生部:«2011中国卫生统计年鉴»