
Common Levels of Confidence >Commonly used confidence levels are 90%, 95%,and 99%,corresponding to the a=0.1, 0.05,and0.01 Confidence Confidence Z value(i.e.,Z Level Coefficient, 1-0 (a/2)value) ☒ 80% .80 1.28 90% .90 1.645 95% .95 1.96 98% .98 2.33 99% .99 2.58 99.8% .998 3.08 99.9% .999 3.27 Statistics for Mar agers Using Microsoft Excel Chap 7-16
Statistics for Managers Using Microsoft Excel Chap 7-16 Common Levels of Confidence Commonly used confidence levels are 90%, 95%, and 99%, corresponding to the α=0.1, 0.05, and 0.01 Confidence Level Confidence Coefficient, Z value(i.e., Z (α/2) value) 1.28 1.645 1.96 2.33 2.58 3.08 3.27 .80 .90 .95 .98 .99 .998 .999 80% 90% 95% 98% 99% 99.8% 99.9% 1

General Formula >The general formula for all confidence intervals is: Point Estimate +(Critical Value)(Standard Error) Margin of error (e) Margin of error (e)=(UCL-LCL)/2 Point Estimate =(UCL+LCL)/2 Confidence Interval=2*Margin of error Statistics fo Microsoft Excel Chap7-17
Statistics for Managers Using Microsoft Excel Chap 7-17 General Formula The general formula for all confidence intervals is: Point Estimate ± (Critical Value)(Standard Error) Margin of error (e) Margin of error (e)=(UCL-LCL)/2 Point Estimate = (UCL+LCL)/2 Confidence Interval=2*Margin of error

Intervals and Level of Confidence Sampling Distribution of the Mean a/2 0/2 Intervals extend from X+zO (1-0)x100% n of intervals to constructed X-zO containμ; √n (o)x100%do not. Confidence Intervals Statistics for Ma agers Using Microsoft Excel Chap 7-18
Statistics for Managers Using Microsoft Excel Chap 7-18 μ μ x Intervals and Level of Confidence Confidence Intervals Intervals extend from to (1- )x100% of intervals constructed contain μ; ( )x100% do not. Sampling Distribution of the Mean n σ X Z n σ X Z x x1 x 2 /2 1 /2

Example >A sample of 11 circuits from a large normal population has a mean resistance of 2.20 ohms.We know from past testing that the population standard deviation is .35 ohms. Determine a 95%confidence interval for the true mean resistance of the population. Statistics for Ma nagers Using Microsoft Excel Chap 7-19
Statistics for Managers Using Microsoft Excel Chap 7-19 Example A sample of 11 circuits from a large normal population has a mean resistance of 2.20 ohms. We know from past testing that the population standard deviation is .35 ohms. Determine a 95% confidence interval for the true mean resistance of the population
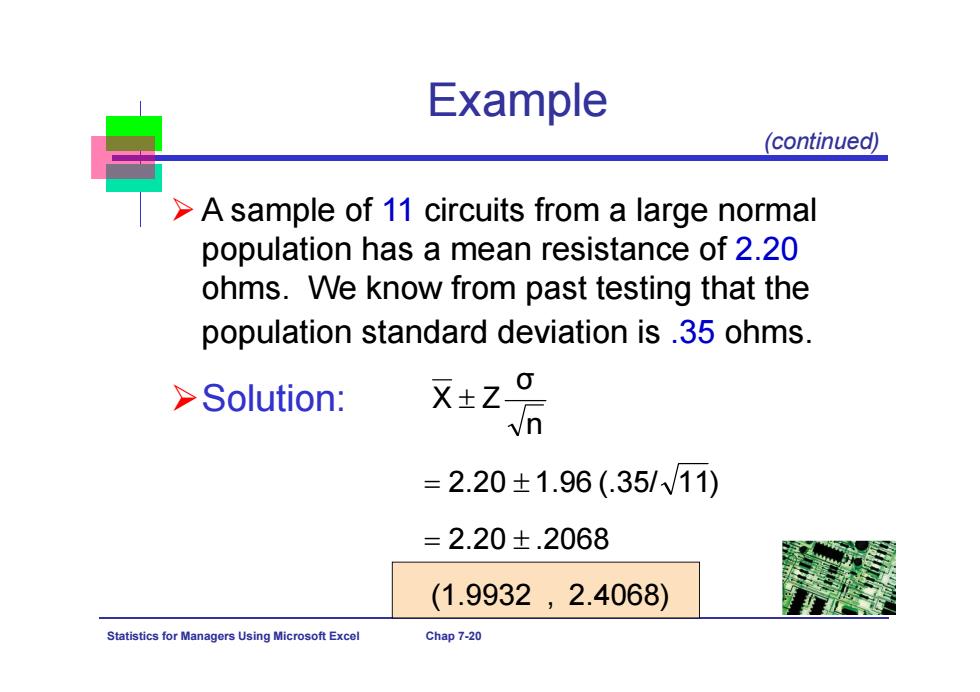
Example (continued) >A sample of 11 circuits from a large normal population has a mean resistance of 2.20 ohms.We know from past testing that the population standard deviation is.35 ohms. Solution: X±Z0 =2.20±1.96(.35/√11) =2.20±.2068 (1.9932,2.4068) Statistics for Managers Using Microsoft Excel Chap 7-20
Statistics for Managers Using Microsoft Excel Chap 7-20 (1.9932 , 2.4068) 2.20 .2068 2.20 1.96 (.35/ 11 ) n σ X Z Example A sample of 11 circuits from a large normal population has a mean resistance of 2.20 ohms. We know from past testing that the population standard deviation is .35 ohms. Solution: (continued)