Level of Confidence >Level of Confidence Confidence in which the interval will contain the unknown population parameter >A percentage(less than 100%),is usually symbolized by(1-a)X100%,where a is the proportion in the tails of the distribution that is outside the confidence interval. Statistics for Ma nagers Using Microsoft Excel Chap 7-11
Statistics for Managers Using Microsoft Excel Chap 7-11 Level of Confidence Level of Confidence Confidence in which the interval will contain the unknown population parameter A percentage (less than 100%), is usually symbolized by (1- )X100%, where is the proportion in the tails of the distribution that is outside the confidence interval
Level of Confidence(1-a) (continued) >Suppose confidence level 95% >Also written (1-a)=.95 >A relative frequency interpretation: In the long run,95%of all the confidence intervals that can be constructed will contain the unknown true parameter >A specific interval either will contain or will not contain the true parameter Statistics for Managers Using Microsoft Excel Chap 7-12
Statistics for Managers Using Microsoft Excel Chap 7-12 Suppose confidence level = 95% Also written (1 - ) = .95 A relative frequency interpretation: In the long run, 95% of all the confidence intervals that can be constructed will contain the unknown true parameter A specific interval either will contain or will not contain the true parameter (continued) Level of Confidence (1- )

Confidence Intervals Confidence Intervals Population Population Mean Proportion o Known o Unknown Statistics for Ma agers Using Microsoft Excel Chap 7-13
Statistics for Managers Using Microsoft Excel Chap 7-13 Confidence Intervals Population Mean σ Unknown Confidence Intervals Population Proportion σ Known
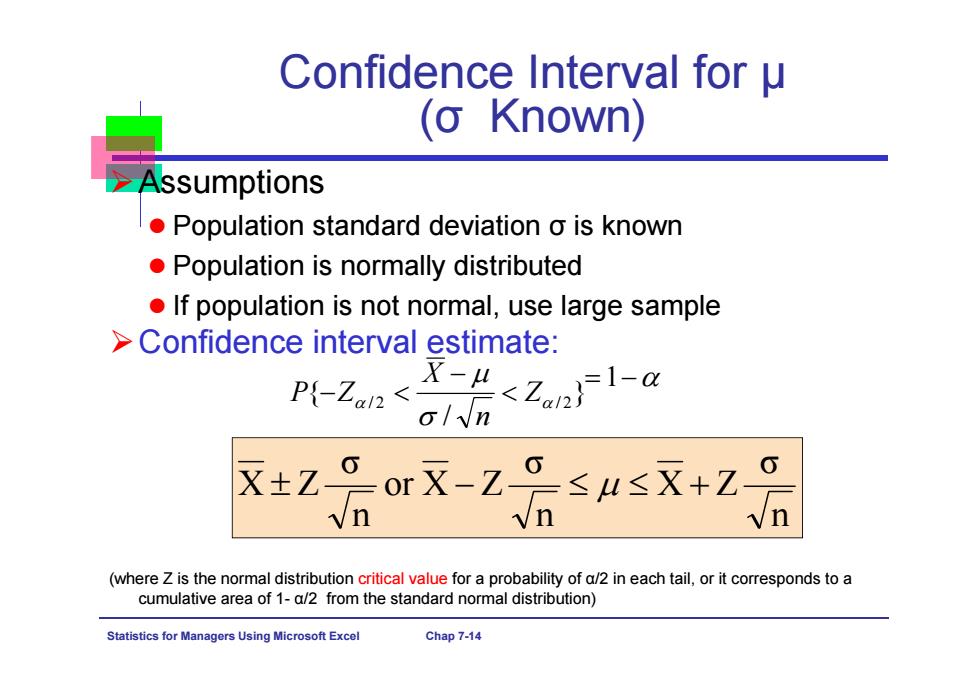
Confidence Interval for u (o Known) Assumptions Population standard deviation o is known Population is normally distributed If population is not normal,use large sample >Confidence interval estimate: Pp-Zan< X-u<Zn1-a ol/n X±Z。orX-Z。≤u≤X+Z (where Z is the normal distribution critical value for a probability of a/2 in each tail,or it corresponds to a cumulative area of 1-a/2 from the standard normal distribution) Statistics for Managers Using Microsoft Excel Chap 7-14
Statistics for Managers Using Microsoft Excel Chap 7-14 Confidence Interval for μ ( σ Known) Assumptions Population standard deviation σ is known Population is normally distributed If population is not normal, use large sample Confidence interval estimate: (where Z is the normal distribution critical value for a probability of α/2 in each tail, or it corresponds to a cumulative area of 1- α/2 from the standard normal distribution) n σ X Z n σ or X Z n σ X Z } / { / 2 / 2 Z n X P Z 1

Finding the Critical Value,Z Z=±1.96 >( Consider a 95%confidence interval: 1-0=.95 2 =.025 a =.025 Z units: Z=-1.96 0 Z=1.96 Lower Upper X units: Confidence Point Estimate Confidence Limit Limit Statistics for Ma Using Microsoft Excel Chap 7-15
Statistics for Managers Using Microsoft Excel Chap 7-15 Finding the Critical Value, Z Consider a 95% confidence interval: Z= -1.96 Z= 1.96 1 .95 .025 2 α .025 2 α Point Estimate Lower Confidence Limit Upper Confidence Limit Z units: X units: Point Estimate 0 Z 1.96