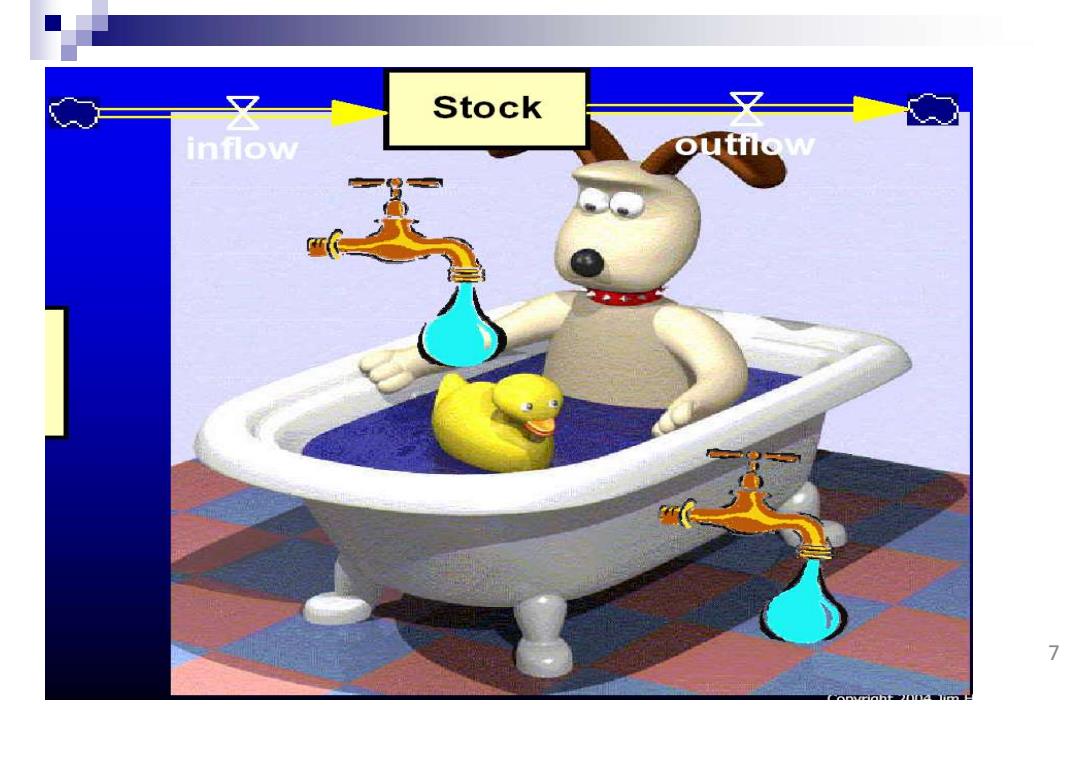
Stock 又 inflow outflaw 7
7
What Causes Dynamics? All dynamics are driven by -Accumulation processes Feedback processes 8
8 What Causes Dynamics? All dynamics are driven by – Accumulation processes Feedback processes
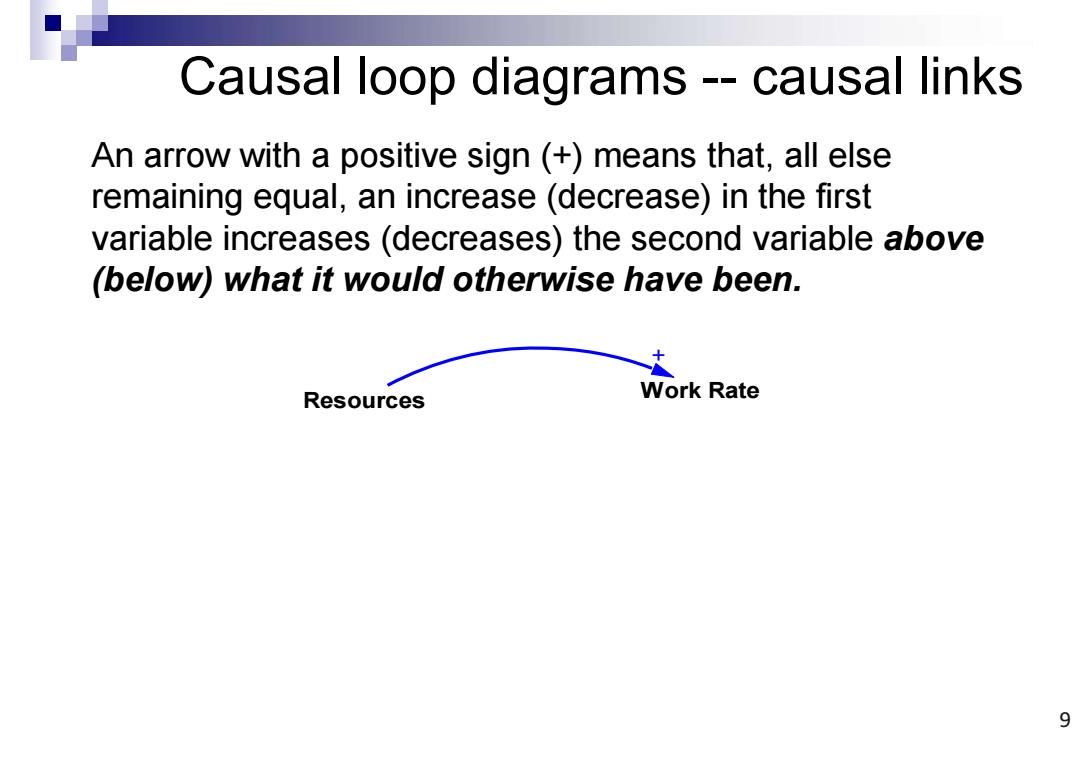
Causal loop diagrams--causal links An arrow with a positive sign (+)means that,all else remaining equal,an increase(decrease)in the first variable increases(decreases)the second variable above (below)what it would otherwise have been. Resources Work Rate 9
Causal loop diagrams -- causal links An arrow with a positive sign (+) means that, all else remaining equal, an increase (decrease) in the first variable increases (decreases) the second variable above (below) what it would otherwise have been. Resources Work Rate + 9

Causal loop diagrams--causal links An arrow with a positive sign (+)means that,all else remaining equal,an increase (decrease)in the first variable increases(decreases)the second variable above (below)what it would otherwise have been. Resources Work Rate An arrow with a negative sign(-)means that,all else remaining equal,an increase (decrease)in the first variable decreases (increases)the second variable below (above)what it otherwise would have been. Fatigue Productiv ity 10
Causal loop diagrams -- causal links An arrow with a positive sign (+) means that, all else remaining equal, an increase (decrease) in the first variable increases (decreases) the second variable above (below) what it would otherwise have been. An arrow with a negative sign (-) means that, all else remaining equal, an increase (decrease) in the first variable decreases (increases) the second variable below (above) what it otherwise would have been. Resources Work Rate + Fatigue Productivity - 10

Inventory Production Shipments Work Rate Resources Productivity Births Population Deaths 11
Inventory Production Shipments Work Rate Resources Productivity Population Births Deaths 11