Organizing Numerical Data: The Polygon A percentage(frequency)polygon is formed by having the midpoint of each class represent the data in that class and then connecting the sequence of midpoints at their respective class percentages(frequency). The cumulative percentage polygon,or ogive,displays the variable of interest along the X axis(not always midpoint), and the cumulative percentages along the Y axis. Statistics for Managers Using Microsoft Excel Chap 2-16 Tongji University,School of Economics Management
Statistics for Managers Using Microsoft Excel Chap 2-16 Tongji University, School of Economics & Management Organizing Numerical Data: The Polygon A percentage (frequency) polygon is formed by having the midpoint of each class represent the data in that class and then connecting the sequence of midpoints at their respective class percentages (frequency). The cumulative percentage polygon, or ogive, displays the variable of interest along the X axis (not always midpoint), and the cumulative percentages along the Y axis
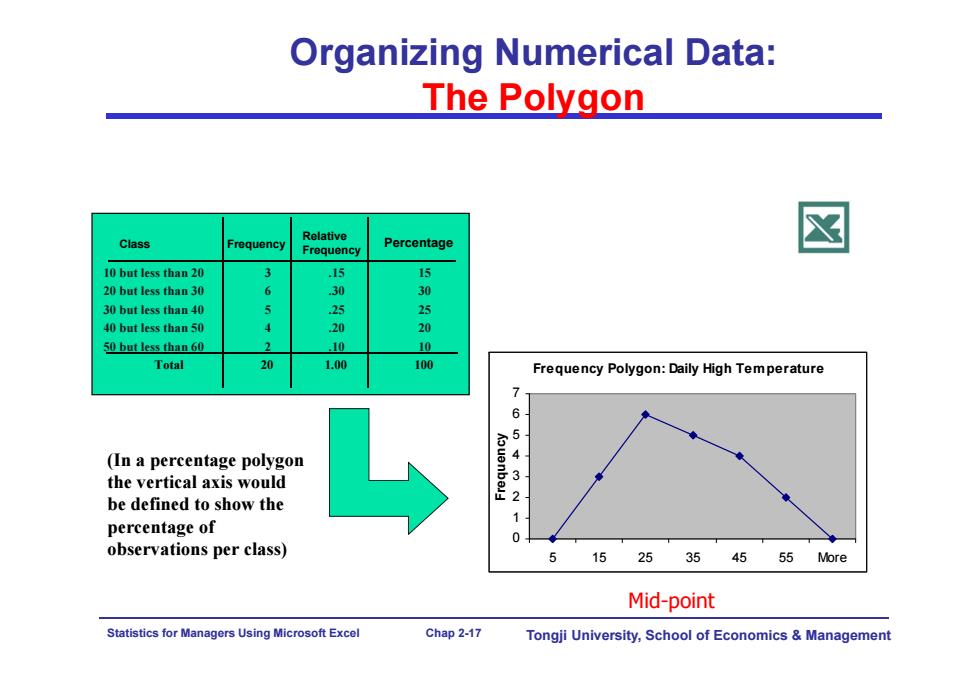
Organizing Numerical Data: The Polygon Class Relative Frequency Percentage ☒ Frequency 10 but less than 20 3 .15 15 20 but less than 30 6 0 3 30 but less than 40 40 but less than 50 20 20 50 but less than 60 10 10 Total 20 1.00 100 Frequency Polygon:Daily High Temperature 7 6 .5 (In a percentage polygon the vertical axis would uanba be defined to show the percentage of 0 observations per class) 51525 354555More Mid-point Statistics for Managers Using Microsoft Excel Chap 2-17 Tongji University,School of Economics Management
Statistics for Managers Using Microsoft Excel Chap 2-17 Tongji University, School of Economics & Management Organizing Numerical Data: The Polygon Frequency Polygon: Daily High Temperature 0 1 2 3 4 5 6 7 5 15 25 35 45 55 More Frequency Class Frequency 10 but less than 20 3 .15 15 20 but less than 30 6 .30 30 30 but less than 40 5 .25 25 40 but less than 50 4 .20 20 50 but less than 60 2 .10 10 Total 20 1.00 100 Relative Frequency Percentage (In a percentage polygon the vertical axis would be defined to show the percentage of observations per class) Mid-point
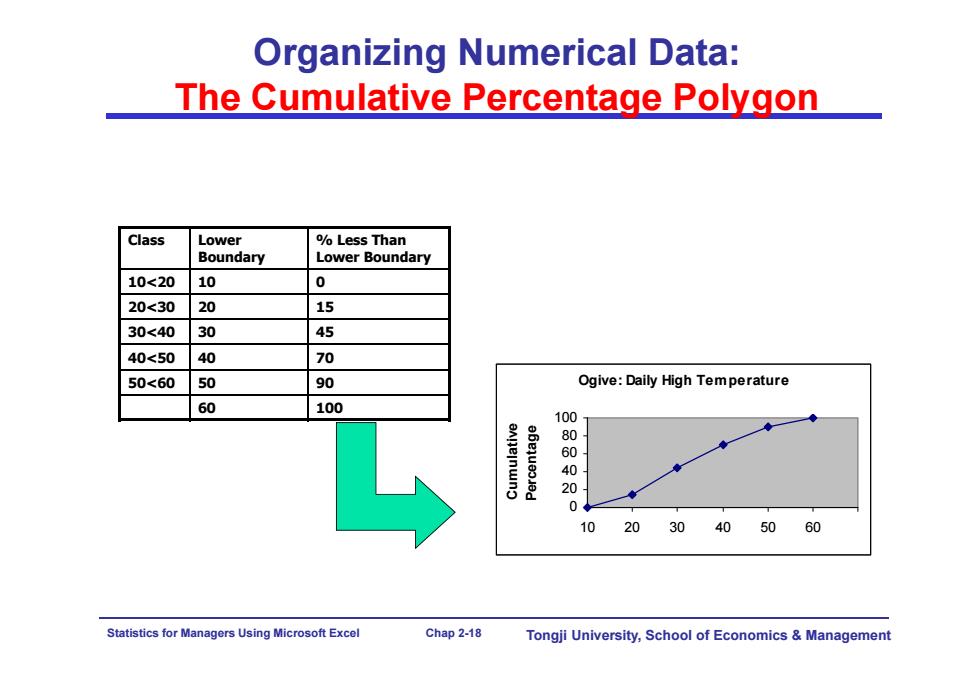
Organizing Numerical Data: The Cumulative Percentage Polygon Class Lower Less Than Boundary Lower Boundary 10<20 10 0 20<30 20 15 30<40 30 45 40<50 40 70 50<60 50 90 Ogive:Daily High Tem perature 60 100 100 enpeinwno 60 20 0 20 30 0 5060 Statistics for Managers Using Microsoft Excel Chap 2-18 Tongji University,School of Economics Management
Statistics for Managers Using Microsoft Excel Chap 2-18 Tongji University, School of Economics & Management Organizing Numerical Data: The Cumulative Percentage Polygon Ogive: Daily High Temperature 0 20 40 60 80 100 10 20 30 40 50 60 Cumulative Percentage Class Lower Boundary % Less Than Lower Boundary 10<20 10 0 20<30 20 15 30<40 30 45 40<50 40 70 50<60 50 90 60 100