
Measures of Central Tendency Review Example House Prices: Mean: ($3,000.000/5) S2,000,000 500,000 =S600,000 300,000 Median:middle value of ranked 100,000 data 100,000 =S300,000 Sum3,000,000 Mode:most frequent value =$100,000 SPSS Statistics for Ma nagers Using Microsoft Excel Chap 3-11
Statistics for Managers Using Microsoft Excel Chap 3-11 Measures of Central Tendency Review Example House Prices: $2,000,000 500,000 300,000 100,000 100,000 Sum 3,000,000 Mean: ($3,000,000/5) = $600,000 Median: middle value of ranked data = $300,000 Mode: most frequent value = $100,000

Descriptive Measures in SPSS Frequencies:Statistics Percentile Values Central Tendency Continue ☐Quar ti1es ☑Mean Cancel ☐Cut points 10 equal ☑Median Help ☐Eercentile ☑Mede Add ☐sun Change Remove ☐Values are group midpoi Dispersion Distribution ☐std. deviati □Minimum ☐Skewness ☐Variance ☐Maximum ☐Kurtosis ☐Range ☐S.E.mean Statistics for Ma agers Using Microsoft Excel Chap 3-12
Statistics for Managers Using Microsoft Excel Chap 3-12 Descriptive Measures in SPSS
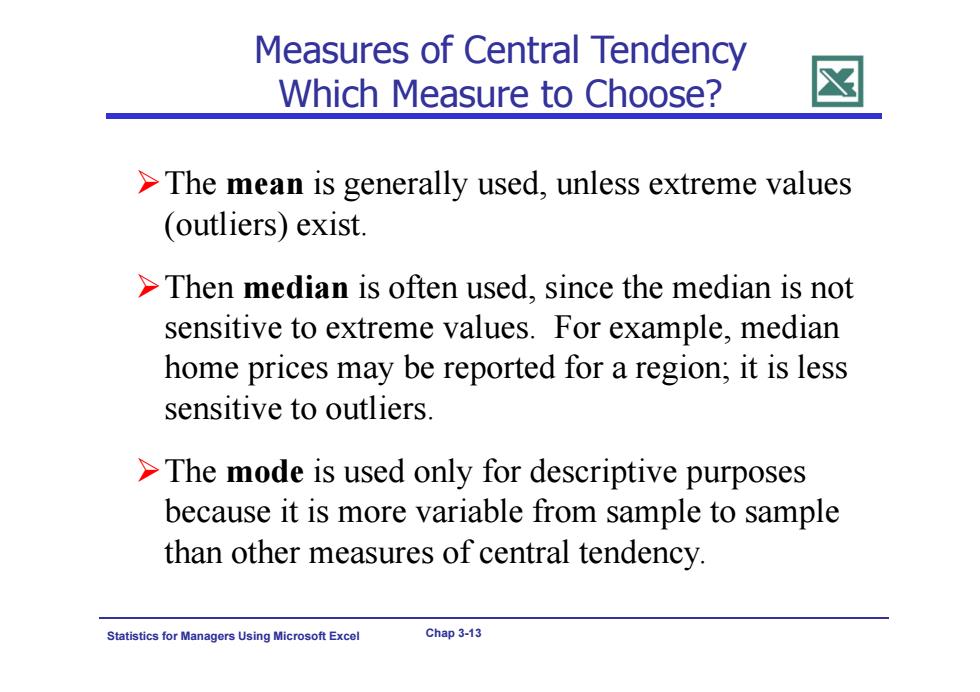
Measures of Central Tendency Which Measure to Choose? >The mean is generally used,unless extreme values (outliers)exist. >Then median is often used,since the median is not sensitive to extreme values.For example,median home prices may be reported for a region;it is less sensitive to outliers. >The mode is used only for descriptive purposes because it is more variable from sample to sample than other measures of central tendency. Statistics agers Using Microsoft Excel Chap 3-13
Statistics for Managers Using Microsoft Excel Chap 3-13 Measures of Central Tendency Which Measure to Choose? The mean is generally used, unless extreme values (outliers) exist. Then median is often used, since the median is not sensitive to extreme values. For example, median home prices may be reported for a region; it is less sensitive to outliers. The mode is used only for descriptive purposes because it is more variable from sample to sample than other measures of central tendency

Quartiles (Percentile) Quartiles are the most widely used measures of non-central location and are used to describe properties of large sets of numerical data. Quartiles split the ranked data into 4 segments with an equal number of values per segment. 25% 25% 25% 25% 介 Qi Q2 Q3 .The first quartile,Q,is the value for which 25%of the observations are smaller and 75%are larger "Q2 is the same as the median (50%are smaller,50%are larger) .Only 25%of the values are greater than the third quartile Statistics for Ma agers Using Microsoft Excel Chap 3-14
Statistics for Managers Using Microsoft Excel Chap 3-14 Quartiles (Percentile) Quartiles are the most widely used measures of non-central location and are used to describe properties of large sets of numerical data. Quartiles split the ranked data into 4 segments with an equal number of values per segment. Q1 Q2 Q3 The first quartile, Q1, is the value for which 25% of the observations are smaller and 75% are larger Q2 is the same as the median (50% are smaller, 50% are larger) Only 25% of the values are greater than the third quartile 25% 25% 25% 25%
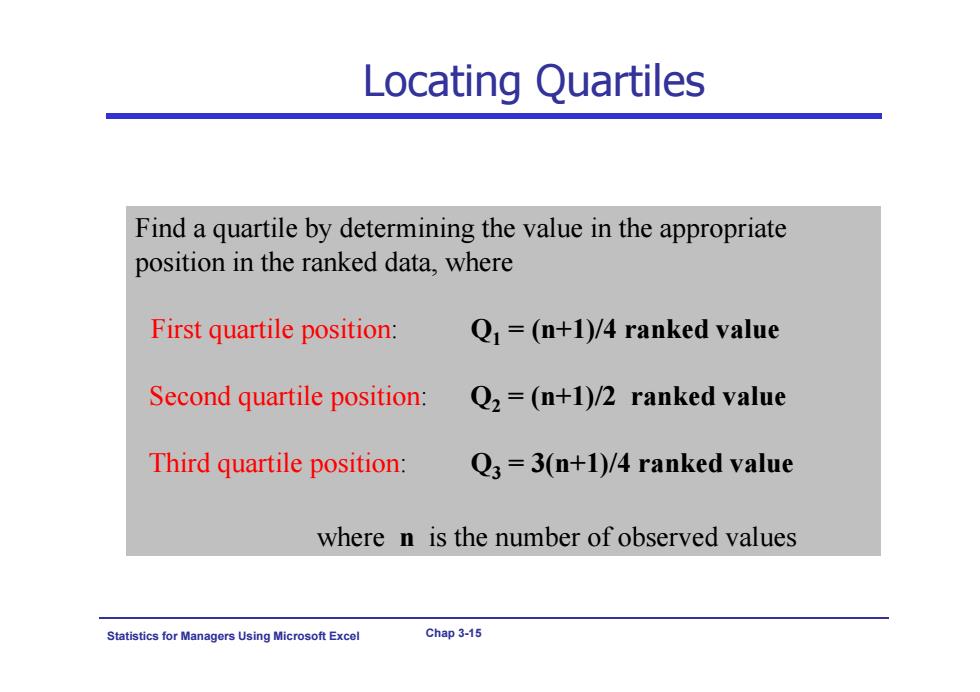
Locating Quartiles Find a quartile by determining the value in the appropriate position in the ranked data,where First quartile position: Q=(n+1)/4 ranked value Second quartile position: Q2=(n+1)/2 ranked value Third quartile position: Q3=3(n+1)/4 ranked value where n is the number of observed values Statistics for Ma agers Using Microsoft Excel Chap 3-15
Statistics for Managers Using Microsoft Excel Chap 3-15 Locating Quartiles Find a quartile by determining the value in the appropriate position in the ranked data, where First quartile position: Q1 = (n+1)/4 ranked value Second quartile position: Q2 = (n+1)/2 ranked value Third quartile position: Q3 = 3(n+1)/4 ranked value where n is the number of observed values