
Chap 16 Sound and hearing
Chap 16 Sound and hearing
Outline Pressure fluctuations ·Sound speed 。Sound intensity Standing sound waves---organ pipe ·Resonance ·Beat ·Doppler effect ·Shock waves
Outline • Pressure fluctuations • Sound speed • Sound intensity • Standing sound waves---organ pipe • Resonance • Beat • Doppler effect • Shock waves
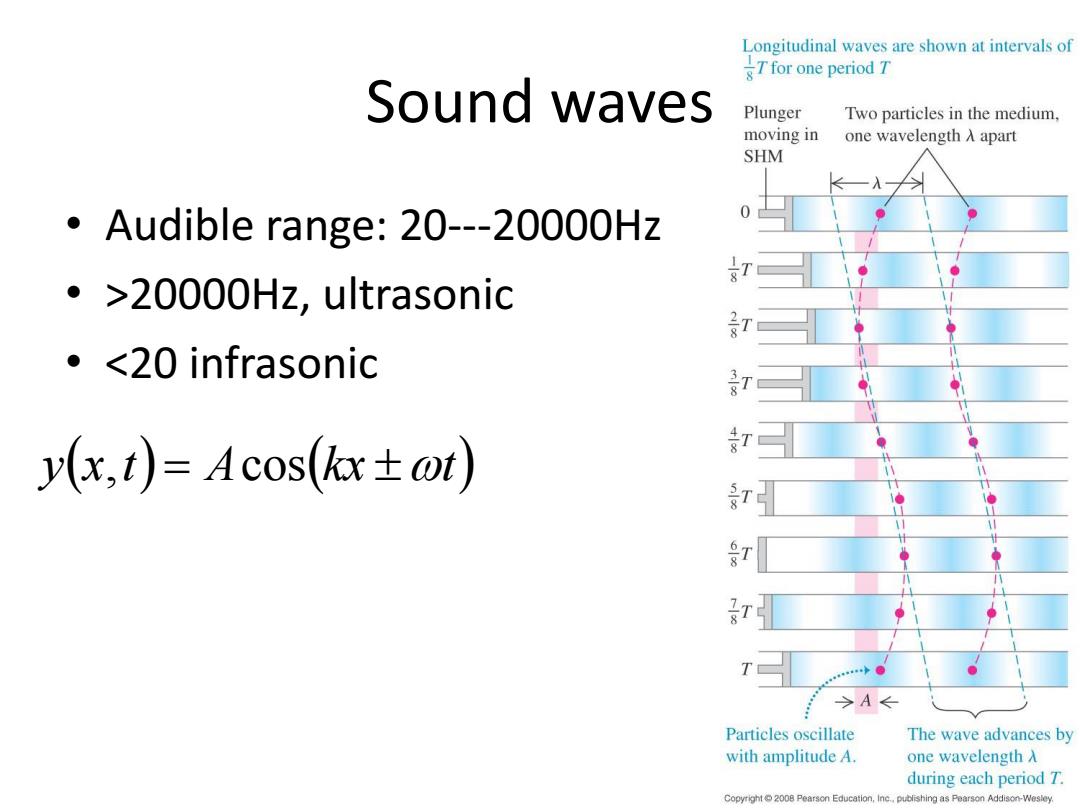
Longitudinal waves are shown at intervals of Tfor one period T Sound waves Plunger Two particles in the medium, moving in one wavelength入apart SHM Audible range:20---20000Hz .>20000Hz,ultrasonic ·<20 infrasonic y(x,t)=Acos(kx±or) t >A← Particles oscillate The wave advances by with amplitude A. one wavelength入 during each period T. Copyright 2008 Pearson Education,Inc..publishing as Pearson Addison-Wesley
Sound waves • Audible range: 20---20000Hz • >20000Hz, ultrasonic • <20 infrasonic yx,t Acoskx t

Pressure fluctuations Undisturbed cylinder of fluid has cross-sectional =y(x,),y2=y(x+△x,t) area S,length Ax,and volume SAx. A sound wave displaces the left ...and the △V=S6y2-y) end of the cylinder right end by by y1=y(x,t)...y2 =y(x Ar,t). dv 1ims0-》_ ov V Ax→0 S△x Ox Bs px,0→Ap(k.=-B.l dv V Ox x+Ax The change in volume of the disturbed If y(x,t)=Acos(kx-ot), cylinder of fluid is S(y2-y). then Ap(x,t)=BAk sin(kx-ot)
Pressure fluctuations ( , ), ( , ) 1 2 y y x t y y x x t 2 1 V S y y x y S x S y y V dV x lim 2 1 0 x y x t p x t B dV V p x t B , , ( , ) px t BAk kx t y x t A kx t then , sin If ( , ) cos( )
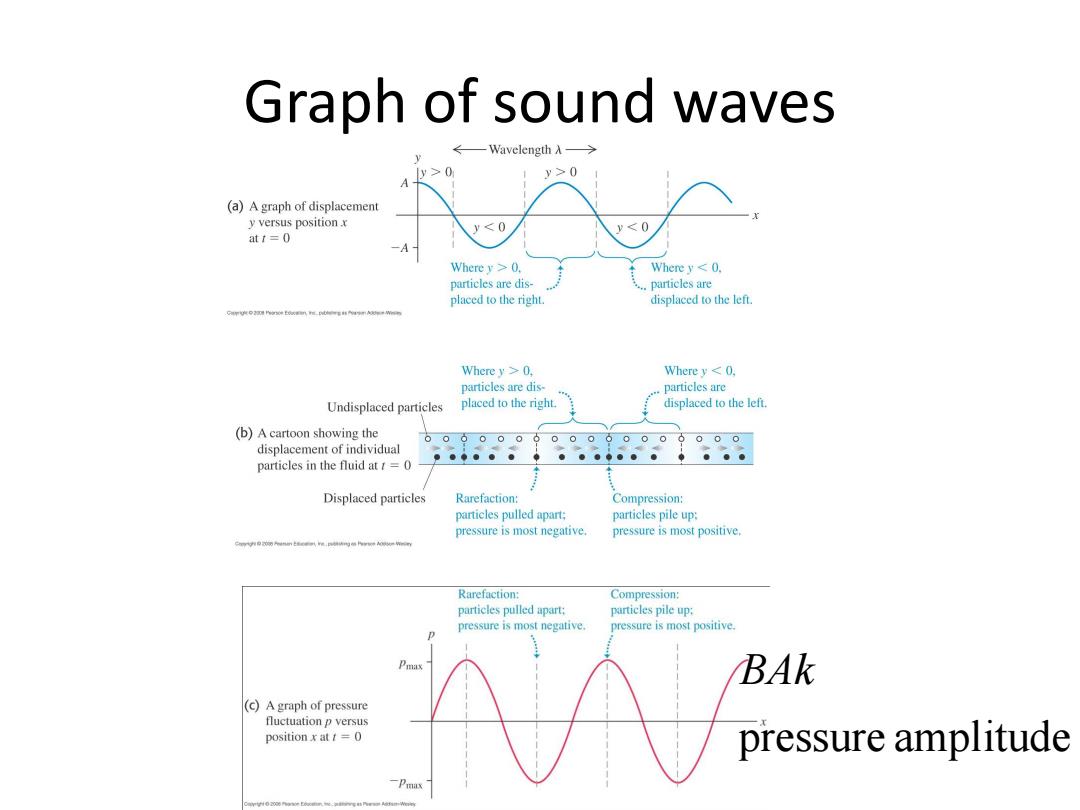
Graph of sound waves ←—Wavelength A> y>0 y>0 (a)A graph of displacement y versus position x v<0 y<0 att=0 Where y>0. Where y<0. particles are dis- particles are placed to the right. displaced to the left. Where y>0, Wherey <0, particles are dis. particles are Undisplaced particles placed to the right. displaced to the left. (b)A cartoon showing the 0000 00000006 000 displacement of individual particles in the fluid at=0 Displaced particles Rarefaction: Compression: particles pulled apart; particles pile up: pressure is most negative. pressure is most positive, Rarefaction: Compression: particles pulled apart: particles pile up: pressure is most negative. pressure is most positive. BAk (c)A graph of pressure fluctuation p versus position x at=0 pressure amplitude
Graph of sound waves pressure amplitude BAk