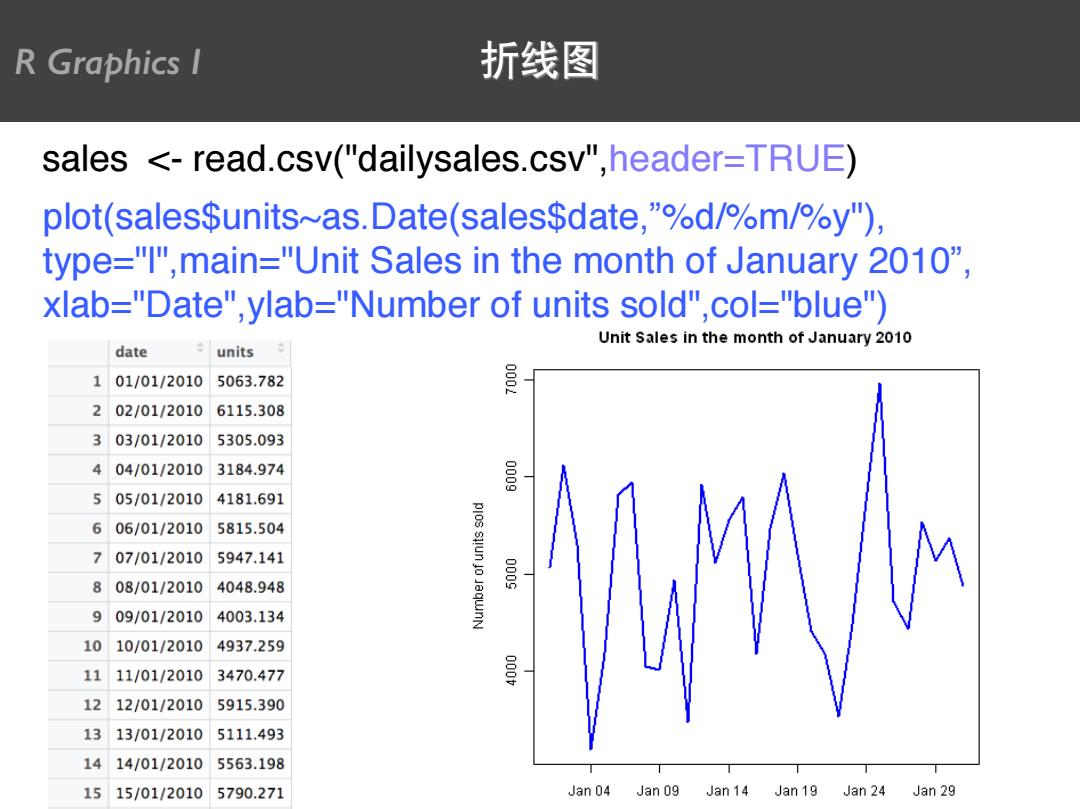
R Graphics I 折线图 sales <-read.csv("dailysales.csv",header=TRUE) plot(salesSunits~as.Date(salessdate,"%d/%m/%y"), type="I",main="Unit Sales in the month of January 2010", xlab="Date",ylab="Number of units sold",col="blue") Unit Sales in the month of January 2010 date units 101/01/2010 5063.782 202/01/2010 6115.308 303/01/2010 5305.093 404/01/2010 3184.974 505/01/2010 4181.691 606/01/2010 5815.504 707/01/2010 5947.141 808/01/2010 4048.948 plos silun jo jaqunN 景 909/01/2010 4003.134 1010/01/2010 4937.259 1111/01/2010 3470.477 1212/01/2010 5915.390 1313/01/2010 5111.493 1414/01/2010 5563.198 1515/01/2010 5790.271 Jan 04 Jan 09 Jan 14 Jan 19 Jan 24 Jan 29
plot(sales$units~as.Date(sales$date,”%d/%m/%y"), type="l",main="Unit Sales in the month of January 2010”, xlab="Date",ylab="Number of units sold",col="blue") sales <- read.csv("dailysales.csv",header=TRUE) R Graphics I 折线图

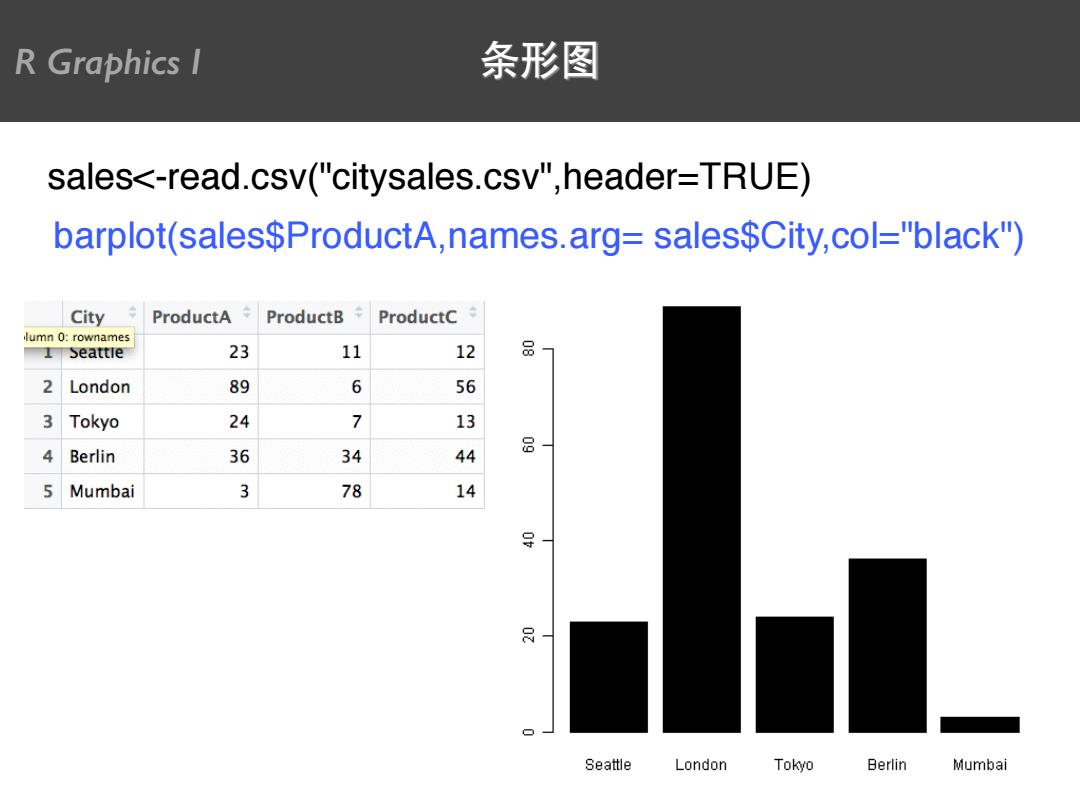
R Graphics I 条形图 sales<-read.csv("citysales.csv",header=TRUE) barplot(sales$ProductA,names.arg=sales$City,col="black") City ProductA ProductB ProductC lumn 0:rownames I Seattie 23 11 12 品 2 London 89 6 56 3 Tokyo 24 1 13 品 4 Berlin 36 34 44 5 Mumbai 3 78 14 Seattle London Tokyo Berlin Mumbai
barplot(sales$ProductA,names.arg= sales$City,col="black") sales<-read.csv("citysales.csv",header=TRUE) R Graphics I 条形图

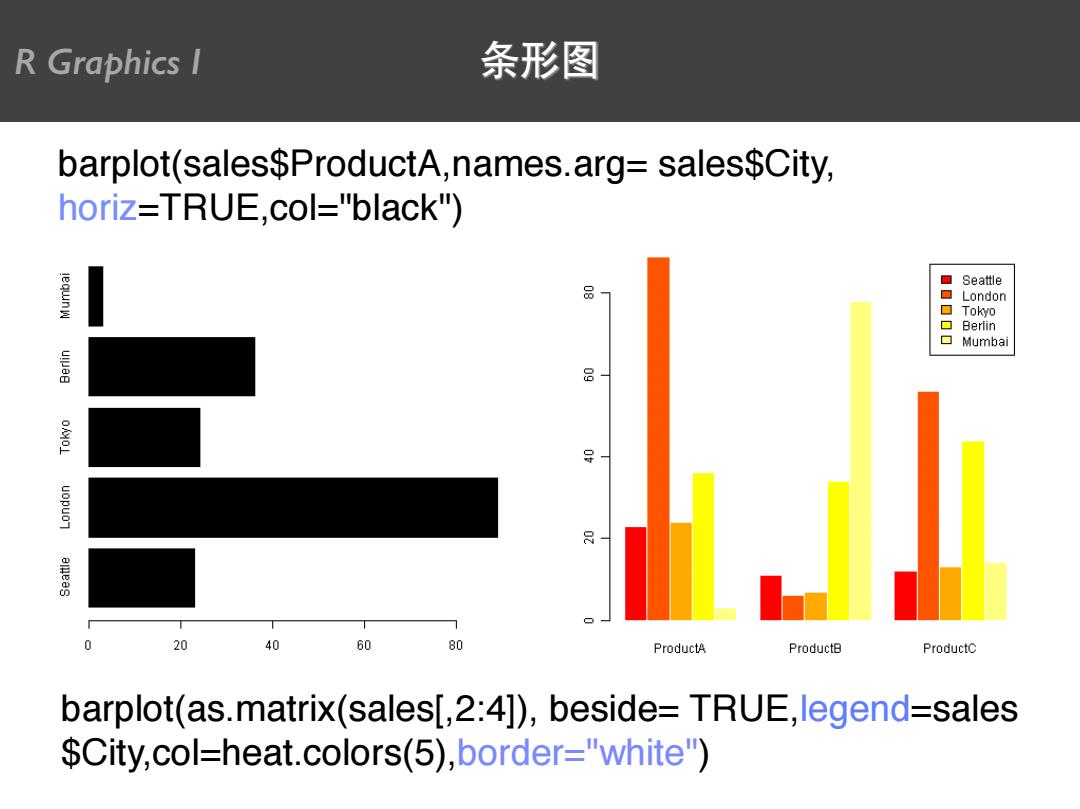
R Graphics l 条形图 barplot(sales$ProductA,names.arg=sales$City, horiz=TRUE,col="black") lequnW ▣Seattle 品 日8wn Tokyo Berlin 口Mumbai 品 导 20 40 60 80 ProductA Product坦 ProductC barplot(as.matrix(sales[,2:4]),beside=TRUE,legend=sales $City,col=heat.colors(5),border="white")
barplot(sales$ProductA,names.arg= sales$City, horiz=TRUE,col="black") barplot(as.matrix(sales[,2:4]), beside= TRUE,legend=sales $City,col=heat.colors(5),border="white") R Graphics I 条形图