
R Graphics I 一个例子 plot(mtcarsswt,mtcars$mpg) abline(lm(mtcarssmpg mtcarsswt)) title("Regression of MPG on Weight") Regression of MPG on Weight 200000m 00 000000 0 P00000 0008° 9 见RiA课本44页 2 3 4 5 mtcarsSwt
R Graphics I 一个例子 ᥠRiA᧞44ᶭ
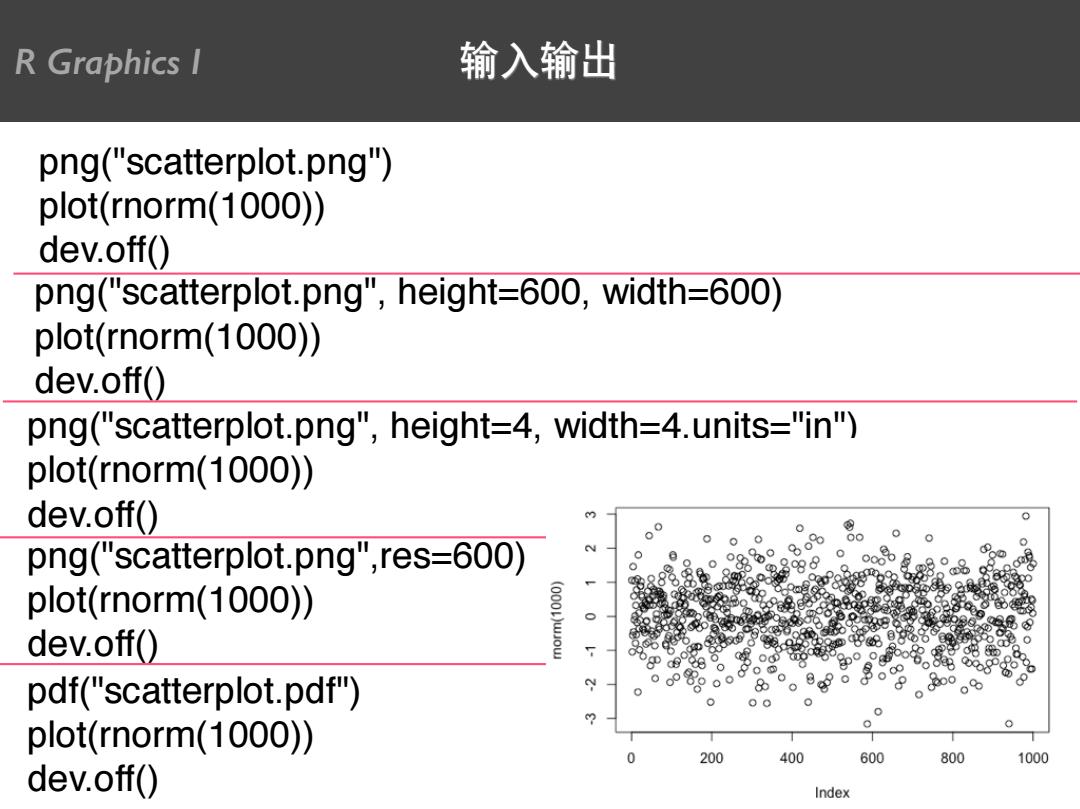
R Graphics l 输入输出 png("scatterplot.png") plot(rnorm(1000)) dev.off() png("scatterplot.png",height=600,width=600) plot(rnorm(1000)) dev.off() png("scatterplot.png",height=4,width=4.units="in") plot(rnorm(1000)) dev.off() png("scatterplot.png",res-600) plot(rnorm(1000)) dev.off() o电 pdf("scatterplot.pdf") 0 00 plot(rnorm(1000)) 200 400 600 800 1000 dev.off() Index
png("scatterplot.png") plot(rnorm(1000)) dev.off() png("scatterplot.png", height=600, width=600) plot(rnorm(1000)) dev.off() png("scatterplot.png", height=4, width=4,units="in") plot(rnorm(1000)) dev.off() png("scatterplot.png",res=600) plot(rnorm(1000)) dev.off() pdf("scatterplot.pdf") plot(rnorm(1000)) dev.off() R Graphics I 输入输出

R Graphics I 另一个例子 表3-1病人对两种药物五个剂量水平上的响应情况 剂量 对药物A的响应 对药物B的响应 20 16 15 30 20 18 40 27 25 45 40 31 60 60 40 t11出口曰11t小△14,日 品 >d0se<-c(20,30,40,45,60) 8 >drugA<-c(16,20,27,40,60 > drugB<-c(15,18,25,31,40) 导 > plot(dose,drugA,type ="b") 号 8 见RiA课本46页 20 30 40 50 60 dose
R Graphics I 另一个例子 ᥠRiA᧞46ᶭ
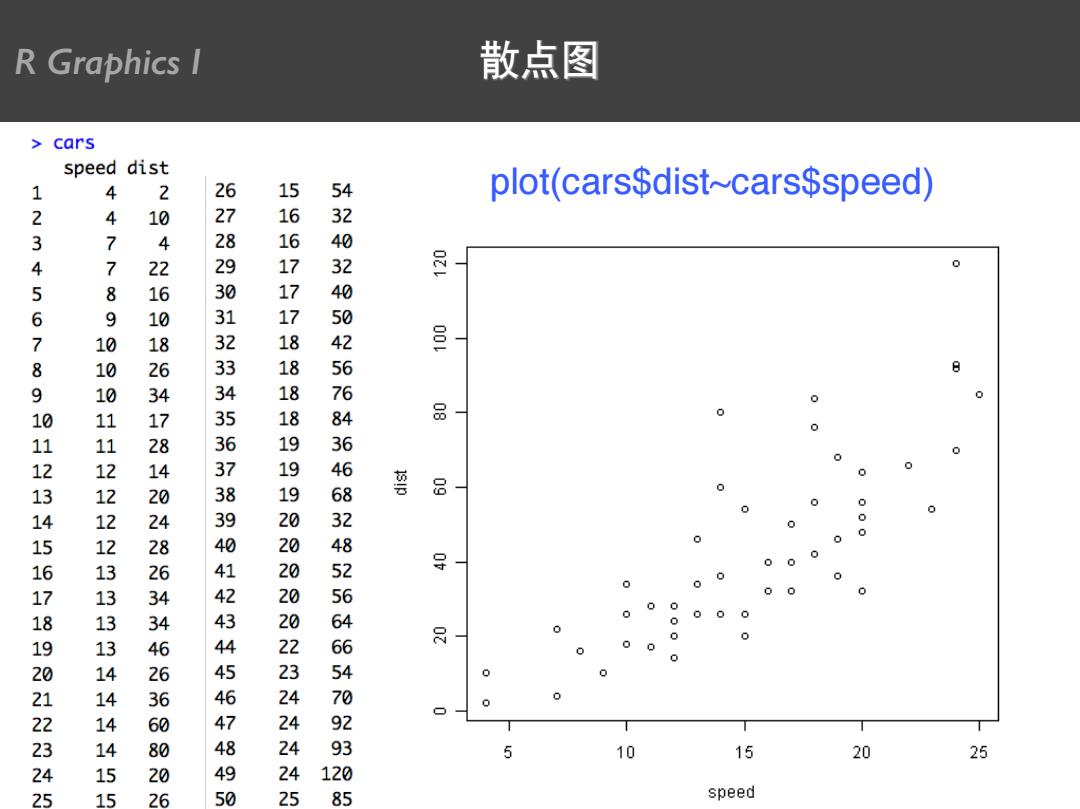
R Graphics I 散点图 cars speed dist 1 plot(cars$dist~cars$speed) 3 4 4477 8 0 56 品- · 89912345678951234 89099112222333344445 21942619186478434864466636826 678951234567899425456789 566777888899903330234444 3256466382182654364029 警 0 0 0 ■ 0 0 0 0 0 000 0 0 0 5 10 15 20 25 120 5 5 26 50 5 85 speed
plot(cars$dist~cars$speed) R Graphics I 散点图

R Graphics I 散点图 plot(cars$dist~cars$speed, main="Relationship between car distance speed", xlab="Speed (miles per hour)", ylab="Distance travelled(miles)", Relationship between car distance and speed xlim=c(0,30), ylim=c(0,140), XaXS=“i", yaxs="j", col="red", 品 pch=19) 品 导 0 5 10 15 20 25 30
plot(cars$dist~cars$speed, main="Relationship between car distance & speed", xlab="Speed (miles per hour)", ylab="Distance travelled (miles)", xlim=c(0,30), ylim=c(0,140), xaxs=“i", yaxs="i", col="red", pch=19) R Graphics I 散点图