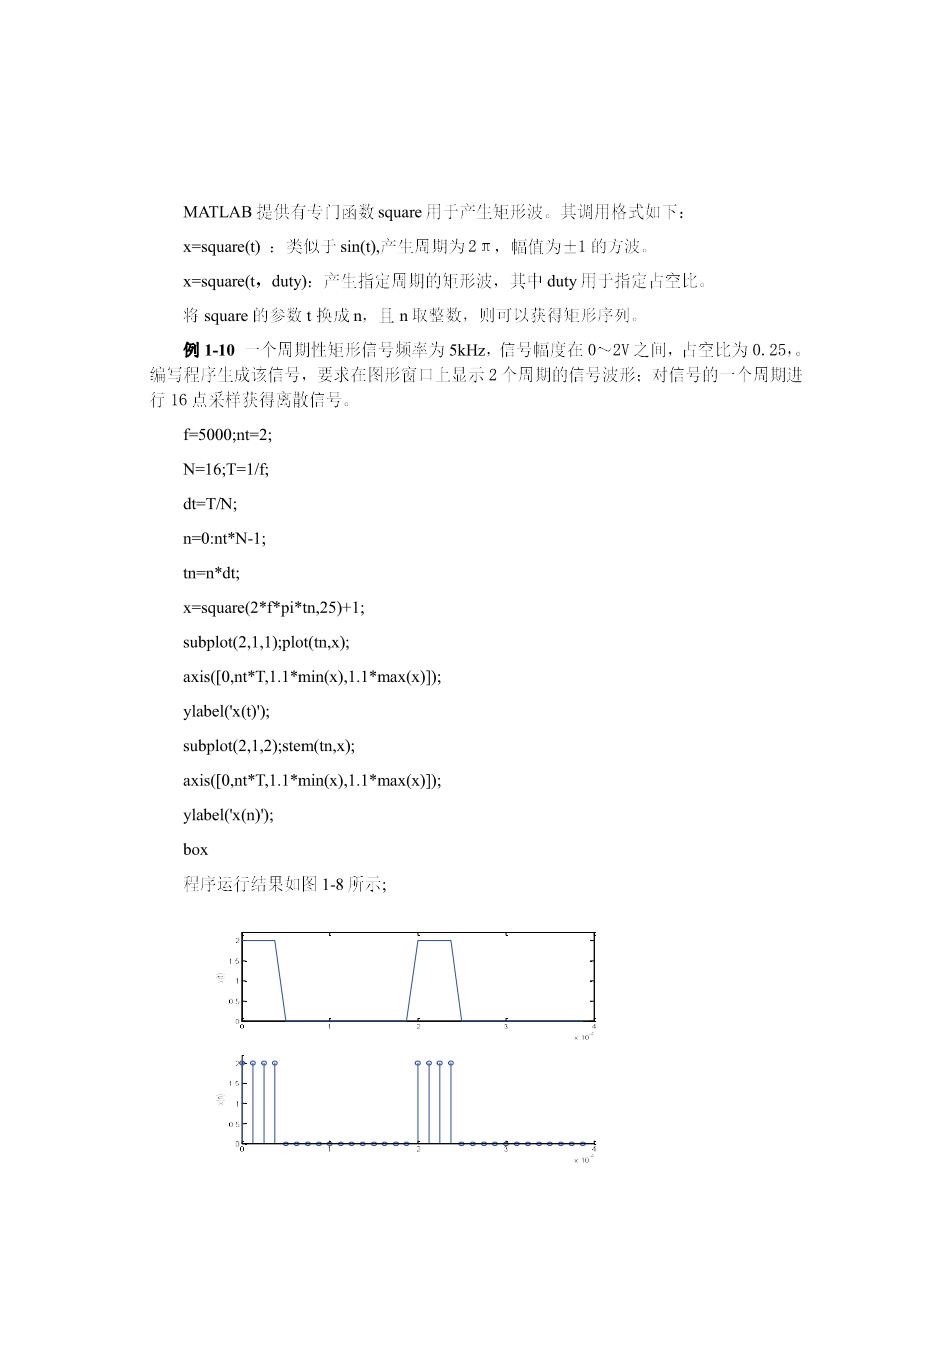
MATLAB提供有专门函数squa心用于产生矩形波.其调用格式如下: x=square(0:类似于sin,产生周期为2R,幅值为士1的方波 x=-square(t,duy沙产.生指定周期的年形波,其中dty用于指定占空 将square的参数t换成n,且n取整数,则可以获得矩形序列。 例1-10一个周性矩形信号频为5k亚,信号幅度在0~2V之间,占空比为0.25 编写程序生成该信号,要求在图形窗口上最示2个周期的信号波形:对信号的·个周期进 行16点采样获得离散信号。 f=5000:mt=2: N=16;T=1/E dt-T/N; n=0:nt*N-1; tn=n*dt; x=square(2*f*pi*tm,25)+1; subplot(2.1.1):plot(tm.x): axis([0.nt*T.1.l*min(x).1.l*max(x)]); ylabel(x()); subplot(2.1.2):stem(tn.x): axis([0,nt*T.1.1*min(x).1.1*max(x)l); vlabel(x(n): box 程序运行结果如图1-8所示
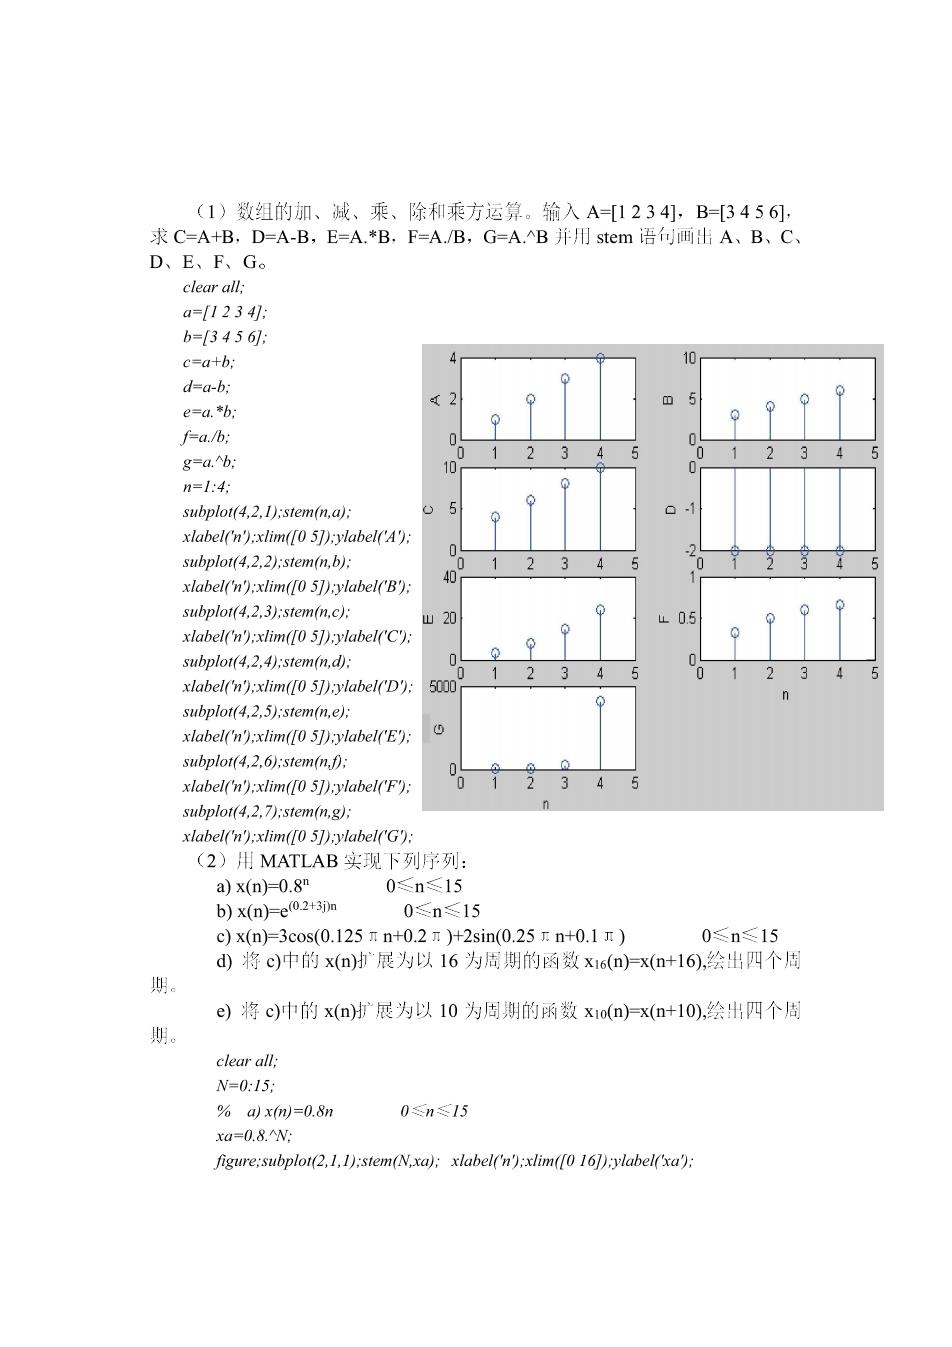
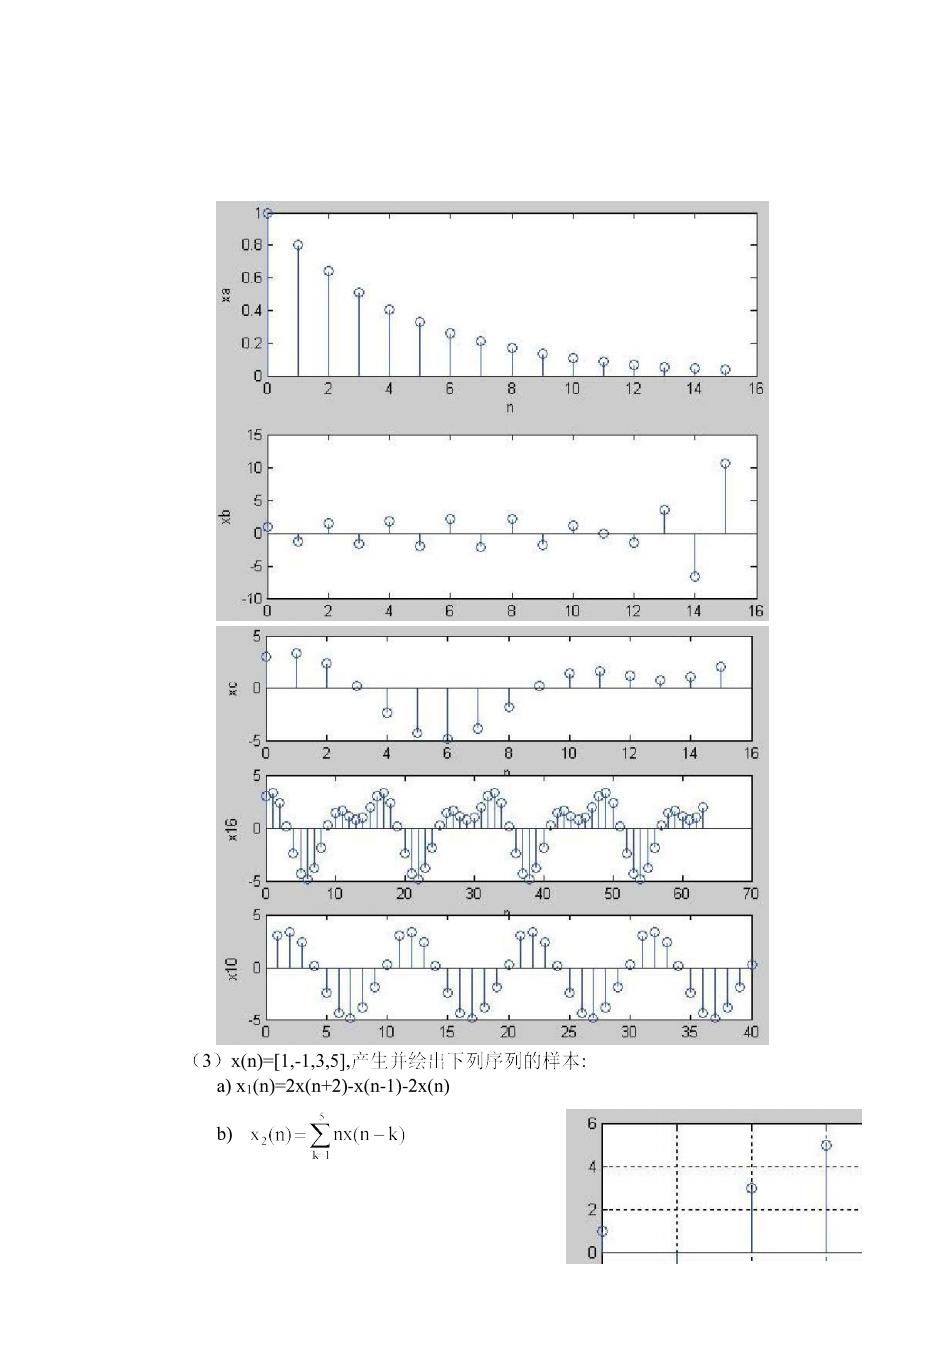
(1)数组的加、减、乘、除和乘方运算。输入A-[1234小,B-3456可 求C=A+B,D-A-B,E=A.*B,F=A.B,G=A.B并用stem语句画出A、B、C D、E、F、G。 clear all. a=1234. c-atb: d=a-b e=a *h f=a/b: g=a."b: subplot(4,2.1):stem(n,a): xlabel(n)xlim(151):ylabel(A): subplot(4.2.2)-stemin.b): xlabel(n):xlim(51):ylabel(B) subplou4.2.3):stem(n.c) 20 xlabel(n):xlim(51):ylabel(C) subplot(4.2.4).stem(n.d): 23 xlabel(n):xlim([05J)ylabel(D). subplot(4.2.e) subplot(4.2.6);stem(n) xlabel('n):xlim(0 51):vlabel(F) subplot(4.2.7stemmn.g): xlabel('n'):xlim(0 51):vlabel('G) (2)用MATLAB实现下列序列: a)x(n)-0.8" 0≤n≤15 b)x(n)-e0.2+3加 0n15 c)x(n)=3cos(0.125Tn+0.2T+2sin(0.25rn+0.1T) 0≤n≤15 d)将c)中的x()展为以16为周期的函数x16(n)-x(n+16),绘出四个周 e)将c)中的x(展为以10为周期的函数x1o()x(+10),绘出四个店 期。 clear all V=u:15: %al x(n)=0.8m 0n≤15 figure:subplot(.1.I):stem(Nxa):xlabel(n:xlim([016J):ylabel(xa)
%bxm=e02+3列m 0≤ns15 xh=ep0.2+3*》*W subplot(2,1.2):stem(N.xb): xlabel('n):xlim(0 161).ylabel(xb)ifigure; %cx)=3cos(0.125rn+0.2F)+2sin0.25Fm+0.17) 0≤n≤15 %d山将c)中的x)力展为以16为丽得的效x16=x+16.会出四个丽僩 k=0:3,m=0 ri=14 rj=1:16 m=m+1 n(m)=N()+16*k() x16(m)=3*cos(0.125*pi=n(m)+0.2*pi)+2*sin(0.25*pi*n(m)+0.1pi): end end em(nx16):xlabel(n):ylabel(x16) )将)中的x0少为以10为周的x10=+10.绘出个期 frj=1:10 x10G)=x160 end r=1:3 for m=1:10 x10i10+m=x10m end end n=1:40: subplot3,1.3):stem(n.x10:xlabel(n):label(x1
08 06 04 02 4 10 12 14 15 12 16 (3)x)[1,-1,3,5],产生并绘出下列序列的样木: a)X1(n)=2x(n+2)-x(n-1)-2x(n) b)x,m)=∑nx(n-k) 2 0
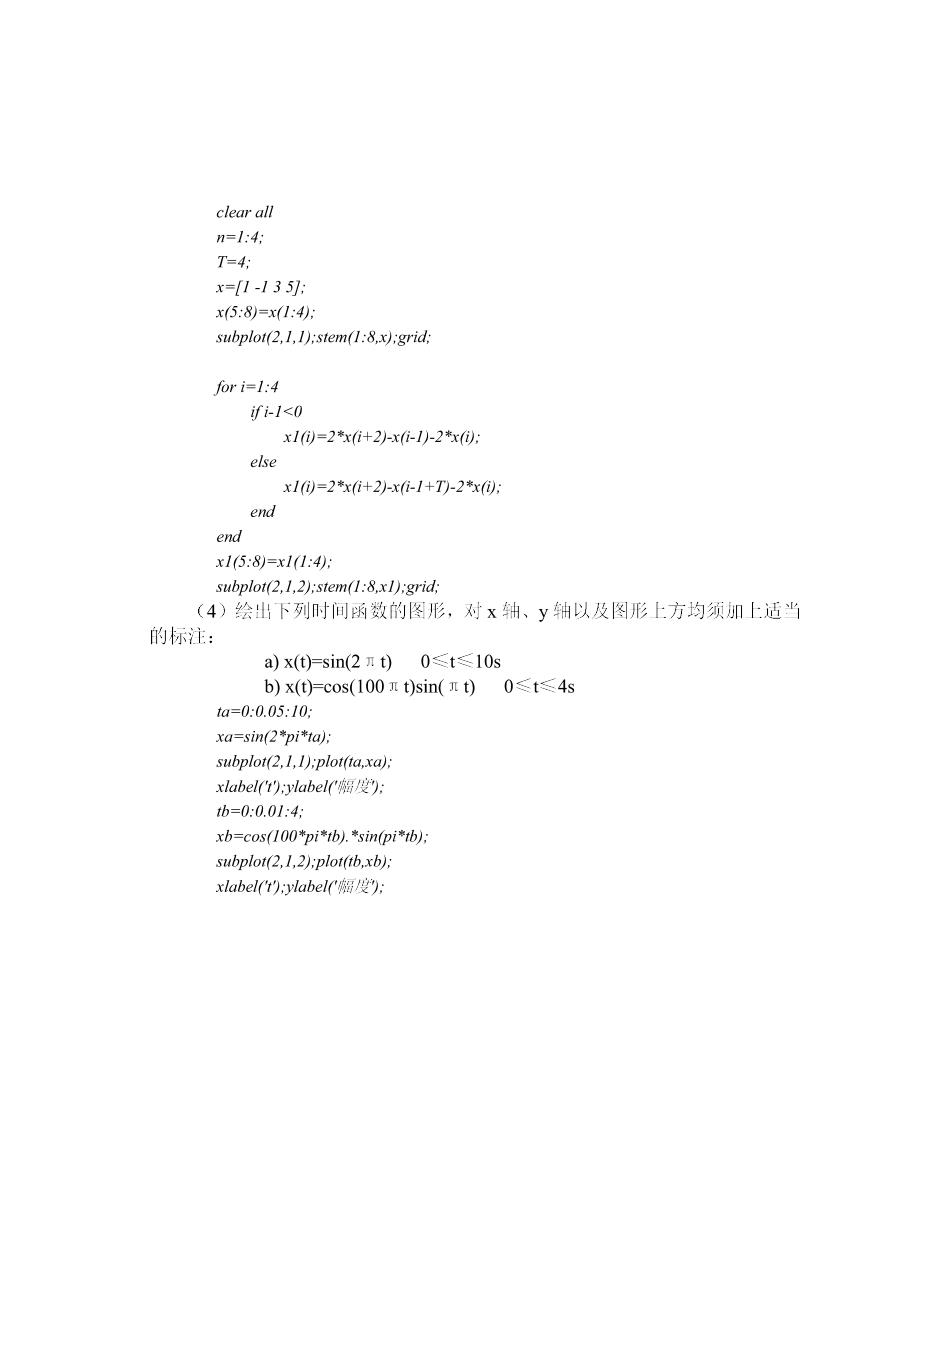
T=4: x=1-135: x5:8)=x1:4)5 subplot(2.1.1):stem(1:8.x):grid for i=1:4 f-1<0 x10-2xi+2小-xi-1少-2x创: else x1)=2*xi+2-x-1+T小-2x end x15:8)=x1(1:4: subplot(2.1.2):stem(1:8.xl):grid: )绘出下列时间函数的图形,对x轴、y轴以及图形上方均须加上适当 的标注 a)x()Fsin(2nt)0s≤t≤10s b)x()=cos(100It)sin(nt)0≤t≤4s ta=0:0.05:10: xa-sin(): subplol(2..I):plol(o.xa) xlabel(t):ylabel() tb=0:0.01:4: xb=cos(100"pi*b).*sin(pi*b): subplot(2.1.2):plor(tb.b):