例2.1建立一个命令文件将变量a,b的值互换, 然后运行该命令文件。 ◆ 程序1: ◆首先建立命令文件并以文件名exch.m存盘: ■clear; ■a=1:10; ■b=[11,12,13,14;15,16,17,18]; ■c=a;a=b;b=c; ■a b ◆然后在MATLAB的命令窗口中输入exch,将会 执行该命令文件。 2015-2 6
2015-2-4 6 程序1: 首先建立命令文件并以文件名exch.m存盘: clear; a=1:10; b=[11,12,13,14;15,16,17,18]; c=a;a=b;b=c; a b 然后在MATLAB的命令窗口中输入exch,将会 执行该命令文件。 例2.1 建立一个命令文件将变量a, b的值互换, 然后运行该命令文件

例如编写M文件计算theta的几个三角函数得 数组theta,再创建一系列的极坐标图形。 ◆打开M文件编辑器,输入命令语句如下: %An M-file script to produce %Comment lines注释行 ◆ %"flower petal"plots ◆theta=-pit0.01:pi; Computations,theta can be rho(1,:)=2*sin(5*theta).^2;assigned outside the script file rho(2,:)cos(10*theta).^3;%(in command window) rho(3,:)=sin(theta).^2; rho(4,:)5*cos(3.5*theta).^3; ◆fork=1:4 ◆ polar(theta,rho(k,:) Graphics output pause %Entering these commands in an M-file called petals.m. end %Typing petals at the MATLAB command line executes the statements %After the script displays a plot,press Return to move to the next plot. 2015-2-4 7
2015-2-4 7 例如编写M文件计算theta 的几个三角函数得 数组theta,再创建一系列的极坐标图形。 打开M文件编辑器,输入命令语句如下: % An M-file script to produce % Comment lines注释行 % "flower petal" plots theta = -pi:0.01:pi; % Computations,theta can be rho(1,:) = 2*sin(5*theta).^2; % assigned outside the script file rho(2,:) = cos(10*theta).^3; %(in command window) rho(3,:) = sin(theta).^2; rho(4,:) = 5*cos(3.5*theta).^3; for k = 1:4 polar(theta,rho(k,:)) % Graphics output pause %Entering these commands in an M-file called petals.m. end %Typing petals at the MATLAB command line executes the statements %After the script displays a plot, press Return to move to the next plot
◆运行后的结果如图2.1所示,单击键盘上的任意键 得到图2.2,再单击任意键,可以得到图2.3,再 单击任意键可以得到图2.4,共计四个图形。 ◆记住: 口命令文件的名称不能和变量名相同,而且必须以字母 开头,命令文件产生的变量都保存在工作空间中,命 令文件可以调用工作空间中任意变量。 2015-2-4 8
2015-2-4 8 运行后的结果如图2.1所示,单击键盘上的任意键 得到图2.2,再单击任意键,可以得到图2.3,再 单击任意键可以得到图2.4,共计四个图形。 记住: 命令文件的名称不能和变量名相同,而且必须以字母 开头,命令文件产生的变量都保存在工作空间中,命 令文件可以调用工作空间中任意变量
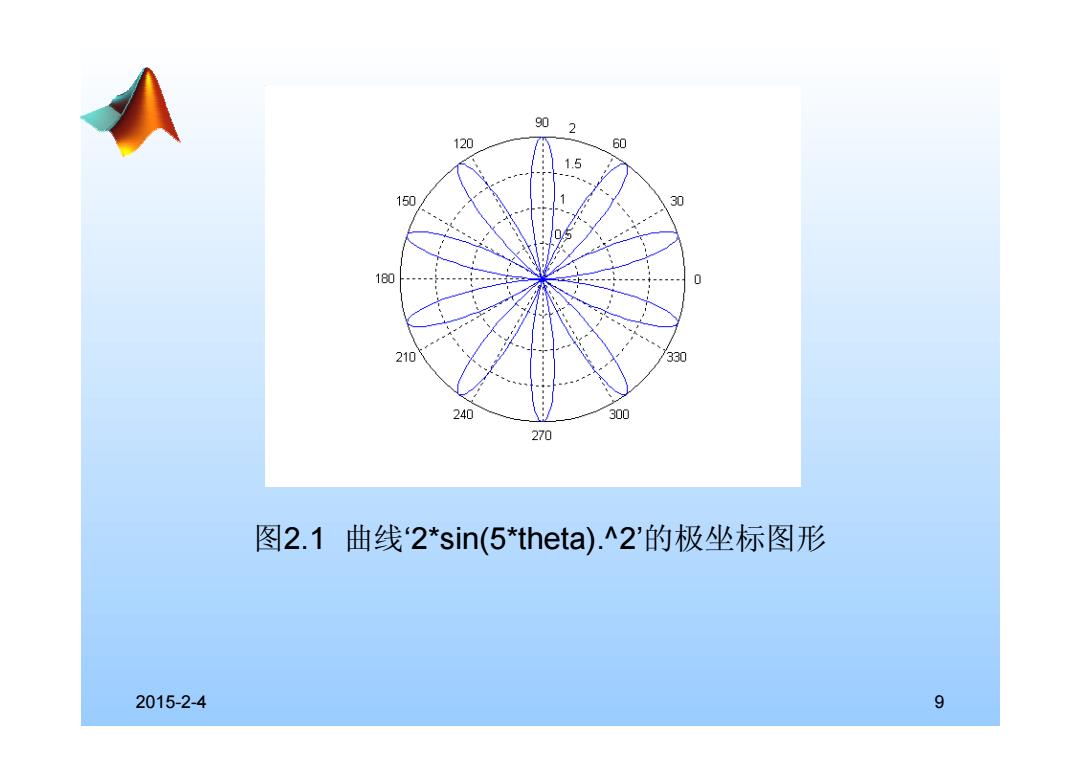
90 2 120 60 1.5 150 30 180 210 330 240 300 270 图2.1曲线‘2*sin(5*theta).2'的极坐标图形 2015-2-4 9
2015-2-4 9 图2.1 曲线‘2*sin(5*theta).^2’的极坐标图形
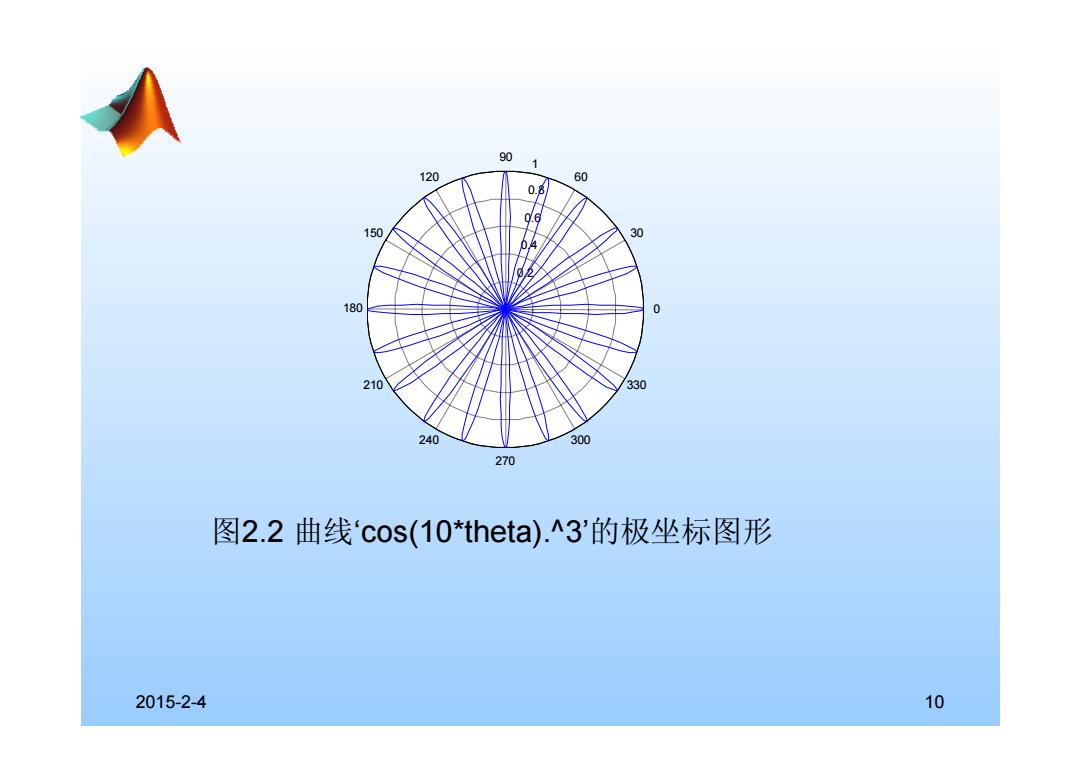
90 1 120 60 150 30 180 0 210 330 240 300 270 图2.2曲线‘cos(10*theta).3'的极坐标图形 2015-2-4 10
2015-2-4 10 图2.2 曲线‘cos(10*theta).^3’的极坐标图形 0.2 0.4 0.6 0.8 1 30 210 60 240 90 270 120 300 150 330 180 0