SHIPPING MARKET OUTLOOK 1.1 Freight Market Overview half year to $5,711/day in the half-year to August.But Panamax earnings were 30%down As business got started again after the summer and Handymax earnings 12.5%down.So there holidays,it rapidly became clear that there had is not much to celebrate. been a change in sentiment.Before the holidays there had been a general feeling that although things would be difficult during the coming Bulkcarrier Earnings censed to The year,there was a reasonable prospect that the Avg.S/day Sep'11- Mar'12- markets would return to a more normal and Feb'12 Hong balanced state fairly quickly.By the end of Aug'12 Change Capesize 25,118 5.711 -77.3% September this positive sentiment had fizzled Panamax(Spot) 9.640 6.494 -32.6% away,to be replaced by an agnostic view which generally recognized that it could be years Panamax (trip) 12,158 8.484 -30.2% before things got back to normal.To some Handymax(52k) 11.870 10,382 -12.5% extent this was due to the way freight rates fell Handysize (t/c) 9.625 8.551 -11.2% over the summer,pushing the Clarksea Index Weighted Avg. 10,207 6.958 -31.8% Kong Polytechnic University. below $9,000/day. Over the past six months the tanker market has Finally the containership sector saw no continued its bumpy ride,with earnings improvement from the rock bottom level fluctuating in the $10,000-$20,000/day band. earnings had reached in the previous half-year. Distribution This averaged out over the six months to give In fact the weighted average was $6,390/day,a an earnings level of $14,157/day,which 3.6%reduction on the previous half-year. represents a decrease of 1.4%compared to the Admittedly these are charter rates,but things were not good for the operators either. is restricted: previous six months.Not a fortune but, allowing for some waiting time,a rate at which most owners could survive.Generally the please VLCCs and dirty products tankers did better Containership Earnings 雪 than previously,whilst the clean products trade Avg.S/day Sep'1l-Mar'12- % had a weak half year.But at least there was a Feb'12 Aug'12 Change ember little cash coming in. 4,400 teu gls 9.167 11.133 21.4% 3.500 teu gls 7.442 7,733 3.9% 2,500 teu gls 8317 7.075 -14.9% Tanker Earnings 2.000 teu gls 7550 6,600 12.6% acknowledge Avg.S/day Sep'll- Mr'12. % 1,700 teu grd 7,608 6,450 15.2% Feb'12 Aug'12 Change 1,000 teu grd 5.692 5.500 -3.4% VLCC (Modern) 23,555 28.459 20.8% 725 teu grd 4,608 4,417 4.1% VLCC (Early '90s) 20,838 25,410 21.9% Weighted Avg. 6,628 6390 -3.6% the source Suezmax(Modern) 20,362 19.269 -5.4% Aframax(Modern) 13,854 14.121 1.9% In conclusion,the last six months has seen the Products(Dirty)) 12.000 16,839 40.3% markets edging from recession into depression. Products(Clean) 12.429 10.672 -14.1% The path has been most severe for the bulk Weighted Avg. 14.364 14,157 -1.4% carrier segment,which is now exhibiting the extremely low earnings levels which are In the bulk carrier market it was a much tougher consistent with the large underlying surplus in six months,and a pretty bumpy ride too.The this market.Much the same is true of the average earnings of $6,958/day over the six containership segment which is also performing months was 31.8%down on the previous half at a level which barely covers operating year.Bearing in mind that earnings figures do expenses,after allowing for a degree of waiting not take account of waiting time,these are time.Tankers did somewhat better,with some seriously loss-making rates for every size of spells of high earnings and an average which http://www.clarksons.nel 01/11/2012 06:20:04 15304 vessel.In particular,the Capesizes saw average leaves operators with at least a little cash in earnings fall from $25,000/day in the previous hand. Clarkson Research Services Autumn 2012
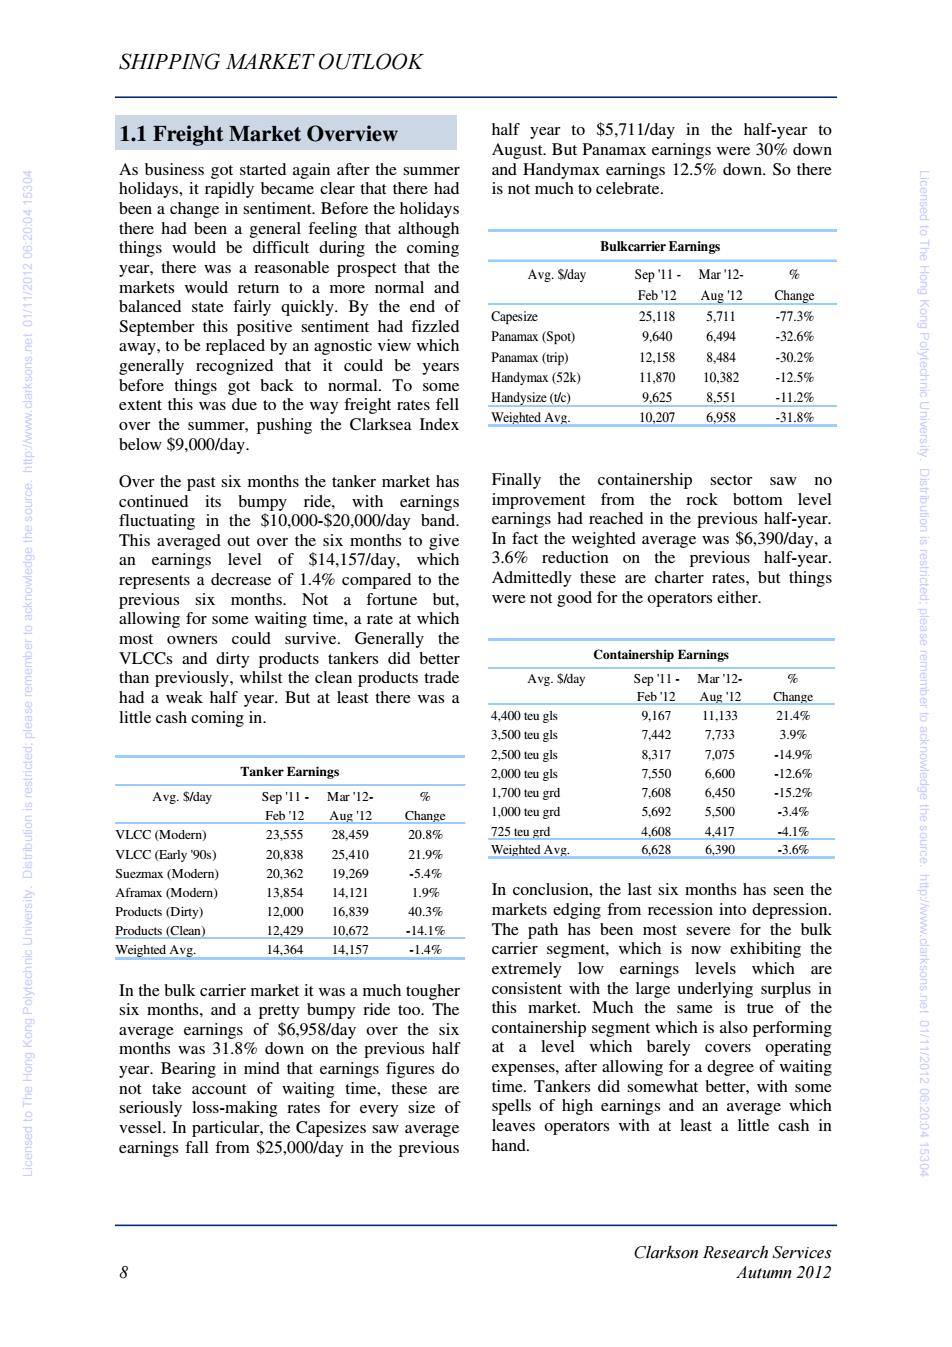
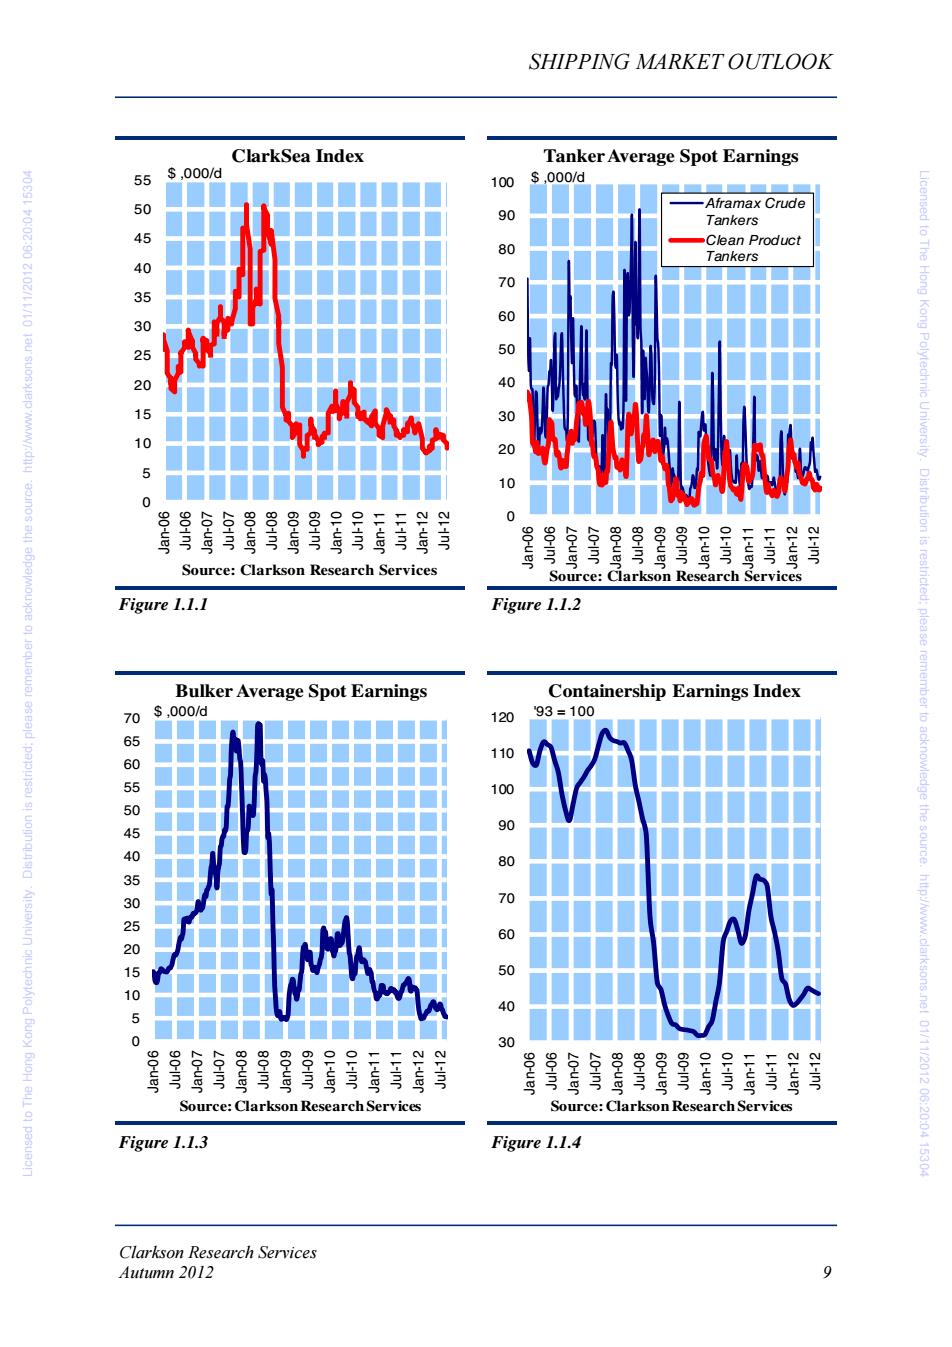
Clarkson Research Services 8 Autumn 2012 SHIPPING MARKET OUTLOOK As business got started again after the summer holidays, it rapidly became clear that there had been a change in sentiment. Before the holidays there had been a general feeling that although things would be difficult during the coming year, there was a reasonable prospect that the markets would return to a more normal and balanced state fairly quickly. By the end of September this positive sentiment had fizzled away, to be replaced by an agnostic view which generally recognized that it could be years before things got back to normal. To some extent this was due to the way freight rates fell over the summer, pushing the Clarksea Index below $9,000/day. Over the past six months the tanker market has continued its bumpy ride, with earnings fluctuating in the $10,000-$20,000/day band. This averaged out over the six months to give an earnings level of $14,157/day, which represents a decrease of 1.4% compared to the previous six months. Not a fortune but, allowing for some waiting time, a rate at which most owners could survive. Generally the VLCCs and dirty products tankers did better than previously, whilst the clean products trade had a weak half year. But at least there was a little cash coming in. In the bulk carrier market it was a much tougher six months, and a pretty bumpy ride too. The average earnings of $6,958/day over the six months was 31.8% down on the previous half year. Bearing in mind that earnings figures do not take account of waiting time, these are seriously loss-making rates for every size of vessel. In particular, the Capesizes saw average earnings fall from $25,000/day in the previous half year to $5,711/day in the half-year to August. But Panamax earnings were 30% down and Handymax earnings 12.5% down. So there is not much to celebrate. Finally the containership sector saw no improvement from the rock bottom level earnings had reached in the previous half-year. In fact the weighted average was $6,390/day, a 3.6% reduction on the previous half-year. Admittedly these are charter rates, but things were not good for the operators either. In conclusion, the last six months has seen the markets edging from recession into depression. The path has been most severe for the bulk carrier segment, which is now exhibiting the extremely low earnings levels which are consistent with the large underlying surplus in this market. Much the same is true of the containership segment which is also performing at a level which barely covers operating expenses, after allowing for a degree of waiting time. Tankers did somewhat better, with some spells of high earnings and an average which leaves operators with at least a little cash in hand. 1.1 Freight Market Overview Tanker Earnings Avg. $/day Sep '11 - Mar '12- % Feb '12 Aug '12 Change VLCC (Modern) 23,555 28,459 20.8% VLCC (Early '90s) 20,838 25,410 21.9% Suezmax (Modern) 20,362 19,269 -5.4% Aframax (Modern) 13,854 14,121 1.9% Products (Dirty) 12,000 16,839 40.3% Products (Clean) 12,429 10,672 -14.1% Weighted Avg. 14,364 14,157 -1.4% Bulkcarrier Earnings Avg. $/day Sep '11 - Mar '12- % Feb '12 Aug '12 Change Capesize 25,118 5,711 -77.3% Panamax (Spot) 9,640 6,494 -32.6% Panamax (trip) 12,158 8,484 -30.2% Handymax (52k) 11,870 10,382 -12.5% Handysize (t/c) 9,625 8,551 -11.2% Weighted Avg. 10,207 6,958 -31.8% Containership Earnings Avg. $/day Sep '11 - Mar '12- % Feb '12 Aug '12 Change 4,400 teu gls 9,167 11,133 21.4% 3,500 teu gls 7,442 7,733 3.9% 2,500 teu gls 8,317 7,075 -14.9% 2,000 teu gls 7,550 6,600 -12.6% 1,700 teu grd 7,608 6,450 -15.2% 1,000 teu grd 5,692 5,500 -3.4% 725 teu grd 4,608 4,417 -4.1% Weighted Avg. 6,628 6,390 -3.6% Licensed to The Hong Kong Polytechnic University. Distribution is restricted; please remember to acknowledge the source. http://www.clarksons.net 01/11/2012 06:20:04 15304 Licensed to The Hong Kong Polytechnic University. Distribution is restricted; please remember to acknowledge the source. http://www.clarksons.net 01/11/2012 06:20:04 15304
SHIPPING MARKET OUTLOOK ClarkSea Index Tanker Average Spot Earnings 6 $,000/d 100 ,000/d -Aframax Crude 90 Tankers 4 Clean Product 80 Tankers 053025 70 60 20 30 1 20 10 0 冒等 20-nr 0 80-uer 80in0 60-uer 60-n OL-uer OL-n L-n Source: Clarkson Research Services Source:Clarkson Research Services Figure 1.1.1 Figure 1.1.2 Bulker Average Spot Earnings Containership Earnings Index 70 $,000/d 120 93=100 110 660550540530252016 100 90 80 70 60 icensed to The Hong Kong Polytechnic University.Distribution is restricted:please remember to acknowledge the source.http://www.clarksons.nel 01/11/2012 06:20:04 15304 10 5 0 0 30 80-uer 601im7 9 L-uer -号 气 呈 00-0e 呈 OL-in Source:Clarkson Research Services Source:Clarkson Research Services Figure 1.1.3 Figure 1.1.4 Clarkson Research Services Autumn 2012 9
Clarkson Research Services Autumn 2012 9 SHIPPING MARKET OUTLOOK Figure 1.1.3 Figure 1.1.4 Figure 1.1.1 Figure 1.1.2 05 10 15 20 25 30 35 40 45 50 55 Jan-06 Jul-06 Jan-07 Jul-07 Jan-08 Jul-08 Jan-09 Jul-09 Jan-10 Jul-10 Jan-11 Jul-11 Jan-12 Jul-12 $ ,000/d Source: Clarkson Research Services ClarkSea Index 0 10 20 30 40 50 60 70 80 90 100 Jan-06 Jul-06 Jan-07 Jul-07 Jan-08 Jul-08 Jan-09 Jul-09 Jan-10 Jul-10 Jan-11 Jul-11 Jan-12 Jul-12 $ ,000/d Source: Clarkson Research Services Tanker Average Spot Earnings Aframax Crude Tankers Clean Product Tankers 05 10 15 20 25 30 35 40 45 50 55 60 65 70 Jan-06 Jul-06 Jan-07 Jul-07 Jan-08 Jul-08 Jan-09 Jul-09 Jan-10 Jul-10 Jan-11 Jul-11 Jan-12 Jul-12 $ ,000/d Source: Clarkson Research Services Bulker Average Spot Earnings 30 40 50 60 70 80 90 100 110 120 Jan-06 Jul-06 Jan-07 Jul-07 Jan-08 Jul-08 Jan-09 Jul-09 Jan-10 Jul-10 Jan-11 Jul-11 Jan-12 Jul-12 '93 = 100 Source: Clarkson Research Services Containership Earnings Index Licensed to The Hong Kong Polytechnic University. Distribution is restricted; please remember to acknowledge the source. http://www.clarksons.net 01/11/2012 06:20:04 15304 Licensed to The Hong Kong Polytechnic University. Distribution is restricted; please remember to acknowledge the source. http://www.clarksons.net 01/11/2012 06:20:04 15304
SHIPPING MARKET OUTLOOK 1.2 World Economy Sea Trade normal long-term growth path of consolidating a diverse group of countries into a financial In our last report in Spring 2012 we noted that union,the immediate consequence is that in economic activity in the major trading areas of 2012,GDP in the European Union is not both the Atlantic and the Pacific had edged expected to grow and the outlook for 2013 down to a point where,in the first quarter of remains weak. 2012,it was hovering on the brink of recession. icensed to The The events of the summer have done nothing to In the United States the story remains change our view that a spell of low economic somewhat better.GDP grew by 1.7%in 2011 growth lies ahead.After the "bounce back" and forecasters are predicting an increase of 2% recovery in 2010 and a fairly good year in 2011 in 2012.But as noted above,this is a weak when world GDP growth reached 3.8%,the performance for an election year and the broad economic trends are now generally on a banking crisis remains unresolved.Japan is also downward path,with world GDP projected to expected to turn in a better performance in grow at only 3.5%in 2012 (see Table 1.1). 2012,as the country slowly recovers from the This projection includes zero growth in the tsunami. Kong Polytechnic University. European Union and relatively slow growth in Asia. Above all else,the major concern in 2012 has been the slower growth of the Chinese This economic slowdown is very much economy.There are growing concerns that the dominated by the "two speed"character of the economy is moving into a more mature phase, Distribution world economy today.The OECD countries are during which the headlong growth of the steel experiencing a very severe slowdown,now industry and its massive imports of iron ore will reaching the standards of a technical recession ease back.For analysts trying to get to grips is restricted: in Europe and Japan.Although the United with China,the problem is that for such a large States is doing a little better,its growth economy,with a complex blend of command performance has remained fragile and management and market forces,it is hard to please disappointing,especially in the six months gain a balanced perspective on what is really leading up to a US election,traditionally a time happening.Can the delicate balancing act of when the government focuses on stimulating developing the less productive inland provinces, economic activity. whilst drifting workers from other provinces to the prosperous coastal states,be maintained?It The main focus in Europe during the last six is a difficult call. months has been the struggle to manage the acknowledge Euro zone crisis.There is continued uncertainty The weaker growth in several of the other Asian about whether the southern states,particularly countries,such as South Korea and India in Greece,will remain within the Euro zone,or particular,adds to the concern that Asia may revert to their old currencies.But this is just a not be able to support the world economy the source symptom of the continuing credit crisis which during this difficult period. remains one of the principal active consequences of the great economic boom in Pulling all this together,the depressed the last decade. conditions in the North Atlantic continue to be offset by brisk but slower growth in the Pacific As many economists predicted at the outset, area and the result is continued positive growth financial easing would eventually run into overall for sea trade.Our projection for total difficulties over the inability of sovereign states growth of 4.3%in full year 2012 is somewhat to meet their obligations.The resulting slower than during the boom years,but it is still escalation of financing costs has left the a positive contribution to demand.Projected European "authorities"with the challenge of trade growth by sector in 2012 currently stands supporting these countries,whilst at the same at:4.2%for the dry bulk trades,2.7%for oil time satisfying themselves that adequate steps trades and 5.5%for container trades.Better,as http://www.clarksons.nel 01/11/2012 06:20:04 15304 are being made to resolve their problems.While the saying goes,than a poke in the eye with a some might regard this as no more than the blunt stick. Clarkson Research Services 10 Autumn 2012
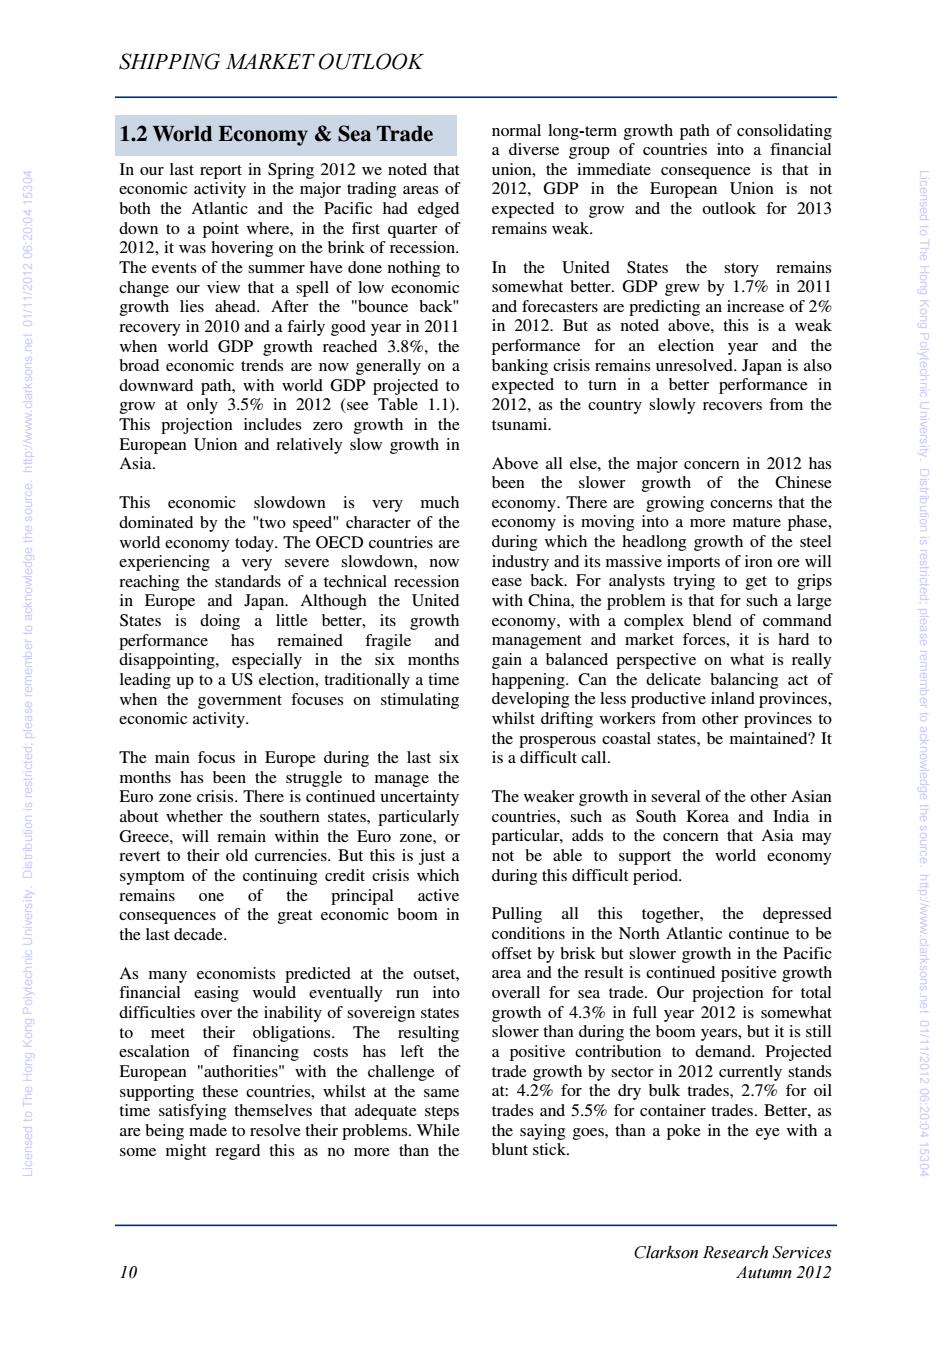
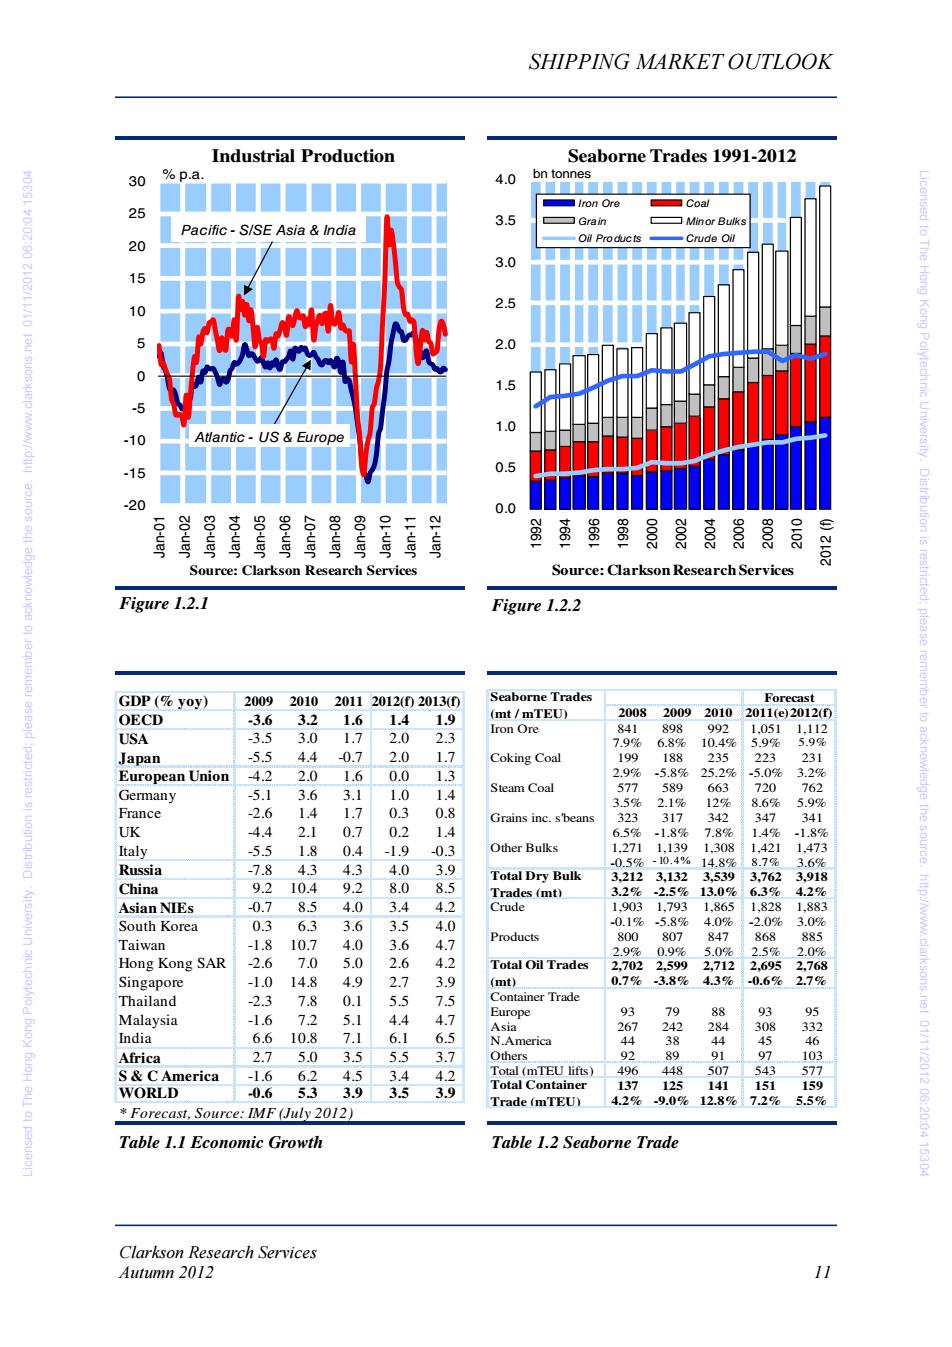
Clarkson Research Services 10 Autumn 2012 SHIPPING MARKET OUTLOOK In our last report in Spring 2012 we noted that economic activity in the major trading areas of both the Atlantic and the Pacific had edged down to a point where, in the first quarter of 2012, it was hovering on the brink of recession. The events of the summer have done nothing to change our view that a spell of low economic growth lies ahead. After the "bounce back" recovery in 2010 and a fairly good year in 2011 when world GDP growth reached 3.8%, the broad economic trends are now generally on a downward path, with world GDP projected to grow at only 3.5% in 2012 (see Table 1.1). This projection includes zero growth in the European Union and relatively slow growth in Asia. This economic slowdown is very much dominated by the "two speed" character of the world economy today. The OECD countries are experiencing a very severe slowdown, now reaching the standards of a technical recession in Europe and Japan. Although the United States is doing a little better, its growth performance has remained fragile and disappointing, especially in the six months leading up to a US election, traditionally a time when the government focuses on stimulating economic activity. The main focus in Europe during the last six months has been the struggle to manage the Euro zone crisis. There is continued uncertainty about whether the southern states, particularly Greece, will remain within the Euro zone, or revert to their old currencies. But this is just a symptom of the continuing credit crisis which remains one of the principal active consequences of the great economic boom in the last decade. As many economists predicted at the outset, financial easing would eventually run into difficulties over the inability of sovereign states to meet their obligations. The resulting escalation of financing costs has left the European "authorities" with the challenge of supporting these countries, whilst at the same time satisfying themselves that adequate steps are being made to resolve their problems. While some might regard this as no more than the normal long-term growth path of consolidating a diverse group of countries into a financial union, the immediate consequence is that in 2012, GDP in the European Union is not expected to grow and the outlook for 2013 remains weak. In the United States the story remains somewhat better. GDP grew by 1.7% in 2011 and forecasters are predicting an increase of 2% in 2012. But as noted above, this is a weak performance for an election year and the banking crisis remains unresolved. Japan is also expected to turn in a better performance in 2012, as the country slowly recovers from the tsunami. Above all else, the major concern in 2012 has been the slower growth of the Chinese economy. There are growing concerns that the economy is moving into a more mature phase, during which the headlong growth of the steel industry and its massive imports of iron ore will ease back. For analysts trying to get to grips with China, the problem is that for such a large economy, with a complex blend of command management and market forces, it is hard to gain a balanced perspective on what is really happening. Can the delicate balancing act of developing the less productive inland provinces, whilst drifting workers from other provinces to the prosperous coastal states, be maintained? It is a difficult call. The weaker growth in several of the other Asian countries, such as South Korea and India in particular, adds to the concern that Asia may not be able to support the world economy during this difficult period. Pulling all this together, the depressed conditions in the North Atlantic continue to be offset by brisk but slower growth in the Pacific area and the result is continued positive growth overall for sea trade. Our projection for total growth of 4.3% in full year 2012 is somewhat slower than during the boom years, but it is still a positive contribution to demand. Projected trade growth by sector in 2012 currently stands at: 4.2% for the dry bulk trades, 2.7% for oil trades and 5.5% for container trades. Better, as the saying goes, than a poke in the eye with a blunt stick. 1.2 World Economy & Sea Trade Licensed to The Hong Kong Polytechnic University. Distribution is restricted; please remember to acknowledge the source. http://www.clarksons.net 01/11/2012 06:20:04 15304 Licensed to The Hong Kong Polytechnic University. Distribution is restricted; please remember to acknowledge the source. http://www.clarksons.net 01/11/2012 06:20:04 15304
SHIPPING MARKET OUTLOOK Industrial Production Seaborne Trades 1991-2012 30 %p.a. 4.0 bn tonnes ■■■■■■■■■■■■■ ▣/ron Ore ▣Coal 25 3.5 0ESL F0:02:90 Z102/LL/10 lau Pacific-S/SE Asia India Grain Minor Bulks 20 Oil Products Crude Oil 3.0 15 10 2.5 2.0 1.5 -5 1.0 -10 Atlantic-US Europe -15 0.5 -20 0.0 8 感国家員賞高胃局 点 Source:Clarkson Research Services Source:Clarkson Research Services Figure 1.2.1 Figure 1.2.2 GDP(%yoy) 2009 201020112012(02013(0 Seaborne Trades Forecast OECD -3.6 3.2 1.6 1.41.9 (mt/mTEU) 2008 2009 2010 2011(e)2012(fD Iron Ore 841 898 992 1.051 1,112 icensed to The Hong Kong Polytechnic University.Distribution is restricted:please remember to acknowledge the source. USA -3.5 3.0 1.7 2.0 2.3 7.9% 687 10.4% 59% 5.99% Japan -5.5 4.4 -0.7 2.0 1.7 Coking Coal 199 188 235 223 231 European Union -4.2 2.0 1.6 0.01.3 2.9% -5.8% 25.2% 5.0% 3.2% 577 589 Germany -5.1 3.6 3.1 1.0 1.4 Steam Coal 663 720 762 3.5% 2.1% 12 8.6% 597 France -2.6 1.4 1.7 0.3 0.8 Grains inc.s'beans 323 317 342 347 341 UK 4.4 2.1 0.7 0.2 1.4 6.5% -1.8% 7.8% 1.4% -1.8% Italy -5.5 1.8 0.4 -1.9 -0.3 Other Bulks 1271 1139 1308 1,421 1,473 8.7% Russia -7.8 4.3 4.3 4.0 3.9 -0.5%-10.4% 14.8% 3.6% Total Dry Bulk 3.212 3.132 3.539 3.762 3.918 China 9.210.4 9.2 8.0 8.5 Trades (mt) 3.2% -2.5% 13.0% 6.3% 4.2% Asian NIEs -0.7 8.5 4.0 3.4 4.2 Crude 1.903 1,793 1,865 1,828 1,883 South Korea 0.3 6.3 3.6 3.5 4.0 -0.16 .58% 4.0% .2.0% 3.0% 800 807 868 885 Taiwan -1.8 10.7 4.0 3.6 4.7 Products 847 2.9% 0.9% 5.0% 2.5% 2.0% Hong Kong SAR -2.6 7.0 5.0 2.6 4.2 Total Oil Trades 2.702 2.599 2,712 2,695 2,768 Singapore -1.0 14.8 4.9 2.7 3.9 (mt) 0.7% 3.8% 4.3% -0.6% 2.79% Thailand -2.3 7.8 0.1 5.5 7.5 Container Trade 79 Malaysia -1.6 7.2 5.1 4.7 Europe 93 88 4.4 93 Asia 267 242 284 308 332 India 6.6 10.8 7.1 6.1 6.5 N.America 44 38 44 45 Africa 2.7 5.0 3.5 5.5 3.7 Others 92 8 91 97 103 S&CAmerica -1.6 6.2 4.5 3.4 4.2 Total (mTEU lifts) 496 448 507 543 577 53 3.9 3.5 3.9 Total Container 137 125 141 151 WORLD -0.6 159 Trade (mTEU) 4.2% -9.0%12.8% 7.2% 5.5% Forecast,Source:IMF (July 2012) http://www.clarksons.nel 01/11/2012 06:20:04 15304 Table 1.1 Economic Growth Table 1.2 Seaborne Trade Clarkson Research Services Autumn 2012 11
Clarkson Research Services Autumn 2012 11 SHIPPING MARKET OUTLOOK Table 1.1 Economic Growth Table 1.2 Seaborne Trade Figure 1.2.1 Figure 1.2.2 -20 -15 -10 -505 10 15 20 25 30 Jan-01 Jan-02 Jan-03 Jan-04 Jan-05 Jan-06 Jan-07 Jan-08 Jan-09 Jan-10 Jan-11 Jan-12 % p.a. Source: Clarkson Research Services Industrial Production Pacific - S/SE Asia & India Atlantic - US & Europe 0.0 0.5 1.0 1.5 2.0 2.5 3.0 3.5 4.0 1992 1994 1996 1998 2000 2002 2004 2006 2008 2010 2012 (f) bn tonnes Source: Clarkson Research Services Seaborne Trades 1991-2012 Iron Ore Coal Grain Minor Bulks Oil Products Crude Oil GDP (% yoy) 2009 2010 2011 2012(f) 2013(f) OECD -3.6 3.2 1.6 1.4 1.9 USA -3.5 3.0 1.7 2.0 2.3 Japan -5.5 4.4 -0.7 2.0 1.7 European Union -4.2 2.0 1.6 0.0 1.3 Germany -5.1 3.6 3.1 1.0 1.4 France -2.6 1.4 1.7 0.3 0.8 UK -4.4 2.1 0.7 0.2 1.4 Italy -5.5 1.8 0.4 -1.9 -0.3 Russia -7.8 4.3 4.3 4.0 3.9 China 9.2 10.4 9.2 8.0 8.5 Asian NIEs -0.7 8.5 4.0 3.4 4.2 South Korea 0.3 6.3 3.6 3.5 4.0 Taiwan -1.8 10.7 4.0 3.6 4.7 Hong Kong SAR -2.6 7.0 5.0 2.6 4.2 Singapore -1.0 14.8 4.9 2.7 3.9 Thailand -2.3 7.8 0.1 5.5 7.5 Malaysia -1.6 7.2 5.1 4.4 4.7 India 6.6 10.8 7.1 6.1 6.5 Africa 2.7 5.0 3.5 5.5 3.7 S & C America -1.6 6.2 4.5 3.4 4.2 WORLD -0.6 5.3 3.9 3.5 3.9 * Forecast, Source: IMF (July 2012) Forecast 2008 2009 2010 2011 ( e )2012 ( f) Iron Ore 841 898 992 1,051 1,112 7.9% 6.8% 10.4% 5.9% 5.9% Coking Coal 199 188 235 223 231 2.9% -5.8% 25.2% -5.0% 3.2% Steam Coal 577 589 663 720 762 3.5% 2.1% 12% 8.6% 5.9% Grains inc. s'beans 323 317 342 347 341 6.5% -1.8% 7.8% 1.4% -1.8% Other Bulks 1,271 1,139 1,308 1,421 1,473 -0.5% - 10.4% 14.8% 8.7% 3.6% 3,212 3,132 3,539 3,762 3,918 3.2% -2.5% 13.0% 6.3% 4.2% Crude 1,903 1,793 1,865 1,828 1,883 -0.1% -5.8% 4.0% -2.0% 3.0% Products 800 807 847 868 885 2.9% 0.9% 5.0% 2.5% 2.0% 2,702 2,599 2,712 2,695 2,768 0.7% -3.8% 4.3% -0.6% 2.7% Container Trade Europe 93 79 88 93 95 Asia 267 242 284 308 332 N.America 44 38 44 45 46 Others 92 89 91 97 103 Total (mTEU lifts) 496 448 507 543 577 137 125 141 151 159 4.2% -9.0% 12.8% 7.2% 5.5% Seaborne Trades (mt / mTEU) Total Dry Bulk Trades (mt ) Total Oil Trades (mt) Total Container Trade (mTEU ) Licensed to The Hong Kong Polytechnic University. Distribution is restricted; please remember to acknowledge the source. http://www.clarksons.net 01/11/2012 06:20:04 15304 Licensed to The Hong Kong Polytechnic University. Distribution is restricted; please remember to acknowledge the source. http://www.clarksons.net 01/11/2012 06:20:04 15304
SHIPPING MARKET OUTLOOK 1.3 The Shipbuilding Market structures accounted for 62%.In 2012 there has been a significant fall in contracting activity, Well,it looks as though 2012 will finally see with ordering down 46%in deadweight and the peak of the shipbuilding cycle,with about the same in CGT.But within this lower deliveries of 169m dwt.Admittedly.this is the tonnage of orders the pattern remained similar. third year running we have called the peak,and Bulk vessels,especially bulk carriers, the shipyards have just kept on going.But the accounted for 45%of the total and specialised icensed to The orderbook is now so depleted that this really 55%. Offshore and LNG ordering remains must be the peak.The problem in predicting active,but the container market was quiet. peak deliveries accurately has been that over Basically most of the Asian shipyards are now the last three years,although many contracts targeting the specialised vessel market,though have slipped into the next year,the mass the marketing emphasis on eco-ship designs for cancellations never happened.Each year a the bulk sector remains active. similar number slipped out at the end of the year,making slippage a zero sum game. Shipbuilding Prices Kong Polytechnic University. Shipbuilding Capacity Against this background,shipbuilding prices have continued to edge downwards.In In 2011 the world's shipyards delivered 49.7m September the Clarkson Newbuilding Index compensated gross tons (CGT)of new ships stood at 127,having fallen by 9%over the first which is a fair indication of current yard three quarters of 2012;the price reduction has Distribution capacity.In 2011 China was,for the second been controlled,however.A VLCC is currently year running,ahead of South Korea with reported at $95m;a Capesize at $46m and a deliveries of 19.2m CGT,a 39%market share. LNG tanker at $201m.Although these prices South Korea's production was 16m CGT giving reflect some discounts,and for the yards may is restricted: it a 32%market share.Japan and Europe include little profit,or even possibly a small produced 9m CGT and 2.7m CGT respectively. loss,they can hardly be regarded as "bargain" please prices.For example,10 years ago a new VLCC During the first three quarters of 2012 the was priced at $65m,and while there have some global orderbook has continued to fall,from currency movements and increases in the price 123m CGT at the start of the year to 100m CGT of steel and some equipment,it is difficult to in August.At current production levels this see how this could add up to more than $30m. represents around 2 years work for the yards,a significant reduction.However the rundown is Looking Ahead less dramatic in CGT than in deadweight,and the orders held by the yards for delivery in 2013 Shipyards are facing a difficult year in 2012, are now 39m CGT,roughly 80%of their with a much lower level of ordering and the current output level.This reflects the fact that focus very much on delivering the existing the source some of the major yards,especially in South orderbook,which they are doing with great Korea,have booked significant quantities of gas success.But the outlook is discouraging.The and offshore orders,which have a very high major shipping markets edging into depression work content relative to their deadweight(CGT and the specialised vessels which have helped is a measure of labour capacity) to boost the orderbook for some yards have,by their nature,limited potential.In addition,there The Product Range Required by the Yards is a shortage of commercial bank finance with the result that CGT deliveries so far this year Over the last 18 months the product mix of are running at three times the rate of new vessels contracted has changed significantly, orders.Today's prices are still not particularly switching away from bulk vessels to the more tempting to speculators and the continued specialised types.For example,in 2011 tankers confusion in the industry over the shape of the and bulk carriers accounted for only 38%of future "eco-ship"suggests that the Autumn http://www.clarksons.nel 01/11/2012 06:20:04 15304 contracts placed,whilst specialised vessels, marketing season is going to be a tough one for particularly LNG,containers and offshore the shipyards. Clarkson Research Services 12 Autumn 2012
Clarkson Research Services 12 Autumn 2012 SHIPPING MARKET OUTLOOK Well, it looks as though 2012 will finally see the peak of the shipbuilding cycle, with deliveries of 169m dwt. Admittedly, this is the third year running we have called the peak, and the shipyards have just kept on going. But the orderbook is now so depleted that this really must be the peak. The problem in predicting peak deliveries accurately has been that over the last three years, although many contracts have slipped into the next year, the mass cancellations never happened. Each year a similar number slipped out at the end of the year, making slippage a zero sum game. Shipbuilding Capacity In 2011 the world's shipyards delivered 49.7m compensated gross tons (CGT) of new ships which is a fair indication of current yard capacity. In 2011 China was, for the second year running, ahead of South Korea with deliveries of 19.2m CGT, a 39% market share. South Korea's production was 16m CGT giving it a 32% market share. Japan and Europe produced 9m CGT and 2.7m CGT respectively. During the first three quarters of 2012 the global orderbook has continued to fall, from 123m CGT at the start of the year to 100m CGT in August. At current production levels this represents around 2 years work for the yards, a significant reduction. However the rundown is less dramatic in CGT than in deadweight, and the orders held by the yards for delivery in 2013 are now 39m CGT, roughly 80% of their current output level. This reflects the fact that some of the major yards, especially in South Korea, have booked significant quantities of gas and offshore orders, which have a very high work content relative to their deadweight (CGT is a measure of labour capacity). The Product Range Required by the Yards Over the last 18 months the product mix of vessels contracted has changed significantly, switching away from bulk vessels to the more specialised types. For example, in 2011 tankers and bulk carriers accounted for only 38% of contracts placed, whilst specialised vessels, particularly LNG, containers and offshore structures accounted for 62%. In 2012 there has been a significant fall in contracting activity, with ordering down 46% in deadweight and about the same in CGT. But within this lower tonnage of orders the pattern remained similar. Bulk vessels, especially bulk carriers, accounted for 45% of the total and specialised 55%. Offshore and LNG ordering remains active, but the container market was quiet. Basically most of the Asian shipyards are now targeting the specialised vessel market, though the marketing emphasis on eco-ship designs for the bulk sector remains active. Shipbuilding Prices Against this background, shipbuilding prices have continued to edge downwards. In September the Clarkson Newbuilding Index stood at 127, having fallen by 9% over the first three quarters of 2012; the price reduction has been controlled, however. A VLCC is currently reported at $95m; a Capesize at $46m and a LNG tanker at $201m. Although these prices reflect some discounts, and for the yards may include little profit, or even possibly a small loss, they can hardly be regarded as "bargain" prices. For example, 10 years ago a new VLCC was priced at $65m, and while there have some currency movements and increases in the price of steel and some equipment, it is difficult to see how this could add up to more than $30m. Looking Ahead Shipyards are facing a difficult year in 2012, with a much lower level of ordering and the focus very much on delivering the existing orderbook, which they are doing with great success. But the outlook is discouraging. The major shipping markets edging into depression and the specialised vessels which have helped to boost the orderbook for some yards have, by their nature, limited potential. In addition, there is a shortage of commercial bank finance with the result that CGT deliveries so far this year are running at three times the rate of new orders. Today’s prices are still not particularly tempting to speculators and the continued confusion in the industry over the shape of the future "eco-ship" suggests that the Autumn marketing season is going to be a tough one for the shipyards. 1.3 The Shipbuilding Market Licensed to The Hong Kong Polytechnic University. Distribution is restricted; please remember to acknowledge the source. http://www.clarksons.net 01/11/2012 06:20:04 15304 Licensed to The Hong Kong Polytechnic University. Distribution is restricted; please remember to acknowledge the source. http://www.clarksons.net 01/11/2012 06:20:04 15304