SECTION I SHIPPING MARKET OUTLOOK CONTENTS ZZI9E 6E:S:80 102/60/9L lou suosyep'Mw/dny ooinos aul abpejmouxpe ol Jaquawal aseald :palbuisal si uonnqsi AllsBAlun aunue leubueys o]pasuaor Licensed to Shanghai Maritime University. EXECUTIVE SUMMARY 7 1.1 FREIGHT MARKET OVERVIEW 8 1.2 WORLD ECONOMY SEA TRADE 10 1.3 THE SHIPBUILDING MARKET 12 1.4 THE DEMOLITION MARKET 14 1.5 DRY BULK MARKET OUTLOOK 16 1.6 TANKER MARKET OUTLOOK 20 1.7 CONTAINERSHIP MARKET OUTLOOK 24 source.http://www.dlarksons.net 15/09/2014 08:45:39 36122
SECTION 1 SHIPPING MARKET OUTLOOK CONTENTS EXECUTIVE SUMMARY 7 1.1 FREIGHT MARKET OVERVIEW 8 1.2 WORLD ECONOMY & SEA TRADE 10 1.3 THE SHIPBUILDING MARKET 12 1.4 THE DEMOLITION MARKET 14 1.5 DRY BULK MARKET OUTLOOK 16 1.6 TANKER MARKET OUTLOOK 20 1.7 CONTAINERSHIP MARKET OUTLOOK 24 Licensed to Shanghai Maritime University. Distribution is restricted; please remember to acknowledge the source. http://www.clarksons.net 15/09/2014 08:45:39 36122 Licensed to Shanghai Maritime University. Distribution is restricted; please remember to acknowledge the source. http://www.clarksons.net 15/09/2014 08:45:39 36122
1.SHIPPING MARKET OUTLOOK EXECUTIVE SUMMARY It has been a better half-year for most parts On the supply side,deliveries fell from a of the shipping industry,as the world economy total of 165m dwt in 2011 to 108m dwt in 2013. has started to recover from the trough and We currently expect a further decline to 96m shipyard deliveries have edged back.The scale dwt in full year 2014,and 88m dwt in 2015, of this recovery is demonstrated by the Clarksea including about 50m dwt/year of bulkers;18m Index,which improved from $9,300/day during dwt/year of tankers;and 14m dwt/year of icensed to Shanghai L12603 the previous half-year(March to August 2013) containerships. to $12,800/day over the last six months,a helpful 38%increase in "take-home"cash. Meanwhile demolition,which had peaked at 58.4m dwt in 2012,fell to 46.1m dwt in 2013. The significance of this improvement is The bulker sector accounted for the most massive.The Clarksea Index is a "best scrapping last year (22.2m dwt),with fewer M南M possible"rate and in a recession few ships tankers sent to the beaches (11.1m dwt in 2013) achieve the full rate,owing to waiting time and but more demolition of containerships (8.9m other factors.So the previous half-year average dwt in 2013),led by increased scrapping of of $9,300/day put a real cash squeeze on the Panamax boxships. businesses,with little margin over OPEX for Dis tribution is contingencies. ▣ Lower deliveries and higher demolition had the result of reducing overall cargo fleet growth This 38%earnings increase has taken many from an unsustainable 9.0%in 2011 to a more vessel types out of dangerous territory,and manageable 3.8%in 2013.As a result,for the produced a positive cash flow,although of first time since 2010,fleet growth matched trade course some shiptypes fared better than others. growth,although in general structural This has contributed to the more positive oversupply remains across the major sectors sentiment in 2014,and a sense that the market is Contacting picked up markedly last year,with at last through the downturn and is now maybe 151.9m dwt ordered in full year 2013,compared 度e on the upswing. to 54.6m dwt in 2012.In the opening two months of 2014,a further 22.8m dwt was Over the last six months the world ordered. economy has taken a turn for the better,though it remains a mixed picture.OECD GDP growth 回 The tanker and bulk carrier markets both edge declined in 2012 and remained very weak in the enjoyed a spike in freight rates in the final first half of 2013,but now looks set to recover quarter of 2013,owing mainly to a seasonal as industrial production of 0.4%in 2013 is surge in cargo volumes,briefly taking earnings the sourde. expected to increase to about 4%in 2014.In the to very healthy levels,but both markets are now non-OECD countries,the story is less positive. back around where they started last year. China's industrial production growth fell to Meanwhile,although the containership charter http://www 9.7%in 2013,and was down to 8.6%in the market continued in the doldrums,the downturn opening two months of 2014.In addition, in contracting during 2012 gave way to a bout of growth in several other Asian countries have heavy ordering in 2013,particularly in the larger slowed,particularly India.Hopefully this will be size sectors. clarksons.net reversed during the year. In summary,shipping markets appear to Despite these mixed trends in the world have edged past the trough of the long recession economy,seaborne trade has continued to grow, and are finally on the upswing.However it is by 4.2%in 2012 and 3.6%in 2013.The current still a long way from a home run.If overall fleet forecast is 4.2%growth in 2014,with dry bulk growth stays close to trade growth,as current up 4.3%;containers up 6.0%;and combined oil trends suggest it will for the next couple of years and products up 2.1%.Provided there are no at least,the significant backlog of surplus 150920140845.3836122 unexpected disruptions,this solid performance tonnage could continue to make its presence felt, should provide a firm foundation as the market leaving the market vulnerable to any future moves past the trough. economic downturn Clarkson Research Services Spring 2014
Clarkson Research Services Spring 2014 7 1. SHIPPING MARKET OUTLOOK SHIPPING MARKET OUTLOOK EXECUTIVE SUMMARY ! It has been a better half-year for most parts of the shipping industry, as the world economy has started to recover from the trough and shipyard deliveries have edged back. The scale of this recovery is demonstrated by the Clarksea Index, which improved from $9,300/day during the previous half-year (March to August 2013) to $12,800/day over the last six months, a helpful 38% increase in “take-home” cash. ! The significance of this improvement is massive. The Clarksea Index is a “best possible” rate and in a recession few ships achieve the full rate, owing to waiting time and other factors. So the previous half-year average of $9,300/day put a real cash squeeze on the businesses, with little margin over OPEX for contingencies. ! This 38% earnings increase has taken many vessel types out of dangerous territory, and produced a positive cash flow, although of course some shiptypes fared better than others. This has contributed to the more positive sentiment in 2014, and a sense that the market is at last through the downturn and is now maybe on the upswing. ! Over the last six months the world economy has taken a turn for the better, though it remains a mixed picture. OECD GDP growth declined in 2012 and remained very weak in the first half of 2013, but now looks set to recover as industrial production of 0.4% in 2013 is expected to increase to about 4% in 2014. In the non-OECD countries, the story is less positive. China's industrial production growth fell to 9.7% in 2013, and was down to 8.6% in the opening two months of 2014. In addition, growth in several other Asian countries have slowed, particularly India. Hopefully this will be reversed during the year. ! Despite these mixed trends in the world economy, seaborne trade has continued to grow, by 4.2% in 2012 and 3.6% in 2013. The current forecast is 4.2% growth in 2014, with dry bulk up 4.3%; containers up 6.0%; and combined oil and products up 2.1%. Provided there are no unexpected disruptions, this solid performance should provide a firm foundation as the market moves past the trough. ! On the supply side, deliveries fell from a total of 165m dwt in 2011 to 108m dwt in 2013. We currently expect a further decline to 96m dwt in full year 2014, and 88m dwt in 2015, including about 50m dwt/year of bulkers; 18m dwt/year of tankers; and 14m dwt/year of containerships. ! Meanwhile demolition, which had peaked at 58.4m dwt in 2012, fell to 46.1m dwt in 2013. The bulker sector accounted for the most scrapping last year (22.2m dwt), with fewer tankers sent to the beaches (11.1m dwt in 2013) but more demolition of containerships (8.9m dwt in 2013), led by increased scrapping of Panamax boxships. ! Lower deliveries and higher demolition had the result of reducing overall cargo fleet growth from an unsustainable 9.0% in 2011 to a more manageable 3.8% in 2013. As a result, for the first time since 2010, fleet growth matched trade growth, although in general structural oversupply remains across the major sectors. Contacting picked up markedly last year, with 151.9m dwt ordered in full year 2013, compared to 54.6m dwt in 2012. In the opening two months of 2014, a further 22.8m dwt was ordered. ! The tanker and bulk carrier markets both enjoyed a spike in freight rates in the final quarter of 2013, owing mainly to a seasonal surge in cargo volumes, briefly taking earnings to very healthy levels, but both markets are now back around where they started last year. Meanwhile, although the containership charter market continued in the doldrums, the downturn in contracting during 2012 gave way to a bout of heavy ordering in 2013, particularly in the larger size sectors. ! In summary, shipping markets appear to have edged past the trough of the long recession and are finally on the upswing. However it is still a long way from a home run. If overall fleet growth stays close to trade growth, as current trends suggest it will for the next couple of years at least, the significant backlog of surplus tonnage could continue to make its presence felt, leaving the market vulnerable to any future economic downturn. Licensed to Shanghai Maritime University. Distribution is restricted; please remember to acknowledge the source. http://www.clarksons.net 15/09/2014 08:45:39 36122 Licensed to Shanghai Maritime University. Distribution is restricted; please remember to acknowledge the source. http://www.clarksons.net 15/09/2014 08:45:39 36122
SHIPPING MARKET OUTLOOK 1.1 Freight Market Overview the bad news is that the increase was from $1,316/day to $4,971/day.All that proves is After a difficult environment in the first half of how misleading percentages can be as a guide 2013,in the last six months tankers and bulkers to market improvement,and it says something have enjoyed a market spike which got the about the changing Panamax market. adrenalin flowing and brought the corpse to life. However the spikes are now over-six months Bulkcarrier Earnings ago,on September 13,2013 the Clarksea Index % #10216031 sat at $11,084/day,and on 28th March 2014 it Avg.S/day Mar'13-Sep'13- was still only $11,553/day.The underlying Aug'13 Feb'14 Change Capesize 9,488 23.554 148.2% surplus remains large,and these spikes probably have more to do with the effect of a Panamax(Spot) 1,316 4.971 277.8% Panamax(trip) 8,014 12.495 55.9% seasonal surge in cargo on a transport system Handymax(52k) 8.697 11.794 35.6% icensed to Shanghai Maritime University which had settled down to slow steaming Handysize(t/c) 7,639 9.573 25.3% Weighted Avg 6,429 10,728 66.9% In the tanker markets,for a couple of months around Christmas it felt like old times.VLCC earnings,which in September last year had Finally, the containership charter market fallen to $8,600/day,surged to $50,000/day, remained firmly in its rut,with the seven ships bounced around until February and then fell types tracked in the table below averaging Dis tribution is back to $14,000/day.The pattern was similar S6,565/day,up from $6,313/day in the previous for the smaller tankers,with Suezmaxes half-year.A disappointing result and one which provides no cheer for the many independent producing the biggest spike,touching $82,000/ day in January.But by March it was "back to container companies struggling for survival, especially those receiving redelivered vessels, plea normal",with earnings bouncing around in the $10-$20,000 band.This is a pattern tanker and even less for their bankers. investors became familiar with in the 1990s. Still,the spike pushed up the average-tanker Containership Earnings earnings averaged $16,278/day over the six Avg.S/day Mar'13- Sep'13- % months,25%up on the previous half-year(see Aug'13 Feb'14 Change 4,400 teu gls 9.033 7.792 table below). Interestingly,the big crude -13.7% carriers topped the charts with a 300%increase 3.500 teu gls 7.008 7.267 3.7% remember to acknowledge 2.500 teu gls 6.792 7.083 ($7,960/day to $31,615/day).Suezmaxes and 4.3% Aframaxes also did very well,seeing a 87%and 2.000 teu gls 6,525 6,600 1.1% 1.700 teu grd 7.033 7.492 6.5% 66%increase in earnings respectively. 1,000 teu grd 6,383 6,600 3.4% the sourde. 725 teu grd 4,817 5.133 6.6% Tanker Earnings Weighted Avg. 6,313 6.565 4.0% Avg.$/day Mar'13- Sep'13- o Aug'13 Feb'14 Change In conclusion,it looks as though over the winter http://ww. VLCC (c.2010-built) 10.405 30.796 196.0% the market has finally passed the trough and is VLCC(c.2000-built) 7.960 31,615 297.2% at last edging upwards.However the upturn has Suezmax (c.2010-built) 13,895 26,022 87.3% more to do with spikes generated by slow Aframax (c.2010-built) 14.005 23,261 66.1% steaming logistics than a fundamental Products(Dirty) 12.089 16.202 34.0% improvement in demand and supply trends. Products(Clean) 13.018 10,753 -17.4% With ships strung out around the world,an Weighted Avg. 13.008 16.278 25.1% uptick in cargo can easily find a shortage of The bulk carriers did even better,producing a ships at the loading zone,which soon 67%increase in average earnings from $6,429 disappears as owners reposition and speed up in o]pas per day in the previous half year to $10,728/ order to take advantage of the higher rates .2218303:54:80410299051ci day in the current half year(see table below). which result.However,the good news is that at The Panamax spot index "topped the charts" least surplus cargo transport capacity is no with a 278%increase -that's the good news longer growing. Clarkson Research Services Spring 2014
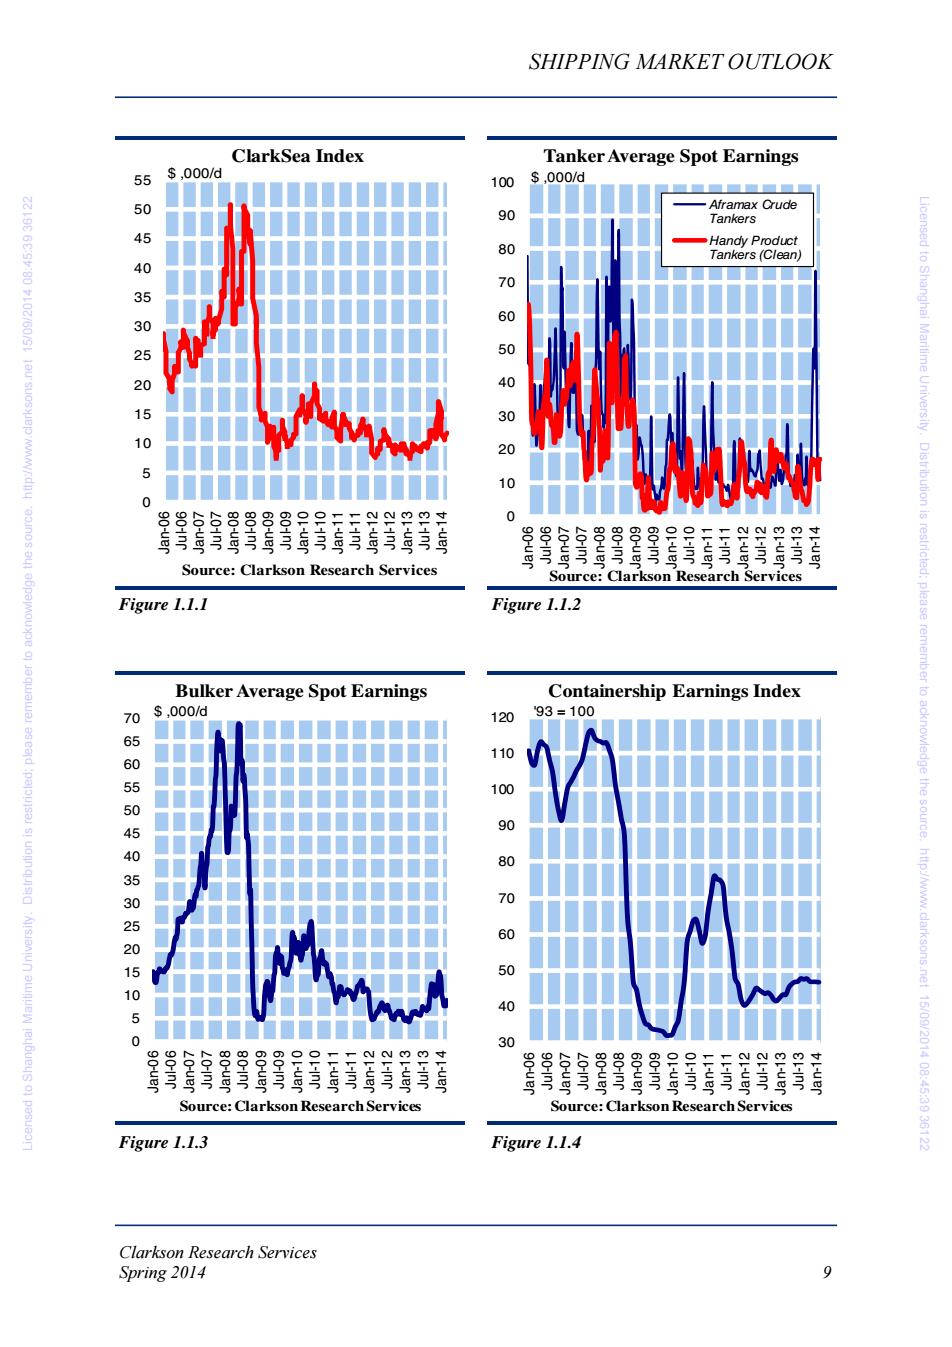
Clarkson Research Services 8 Spring 2014 SHIPPING MARKET OUTLOOK After a difficult environment in the first half of 2013, in the last six months tankers and bulkers have enjoyed a market spike which got the adrenalin flowing and brought the corpse to life. However the spikes are now over - six months ago, on September 13, 2013 the Clarksea Index sat at $11,084/day, and on 28th March 2014 it was still only $11,553/day. The underlying surplus remains large, and these spikes probably have more to do with the effect of a seasonal surge in cargo on a transport system which had settled down to slow steaming. In the tanker markets, for a couple of months around Christmas it felt like old times. VLCC earnings, which in September last year had fallen to $8,600/day, surged to $50,000/day, bounced around until February and then fell back to $14,000/day. The pattern was similar for the smaller tankers, with Suezmaxes producing the biggest spike, touching $82,000/ day in January. But by March it was "back to normal", with earnings bouncing around in the $10-$20,000 band. This is a pattern tanker investors became familiar with in the 1990s. Still, the spike pushed up the average - tanker earnings averaged $16,278/day over the six months, 25% up on the previous half-year (see table below). Interestingly, the big crude carriers topped the charts with a 300% increase ($7,960/day to $31,615/day). Suezmaxes and Aframaxes also did very well, seeing a 87% and 66% increase in earnings respectively. The bulk carriers did even better, producing a 67% increase in average earnings from $6,429 per day in the previous half year to $10,728/ day in the current half year (see table below). The Panamax spot index “topped the charts” with a 278% increase - that's the good news - the bad news is that the increase was from $1,316/day to $4,971/day. All that proves is how misleading percentages can be as a guide to market improvement, and it says something about the changing Panamax market. Finally, the containership charter market remained firmly in its rut, with the seven ships types tracked in the table below averaging $6,565/day, up from $6,313/day in the previous half-year. A disappointing result and one which provides no cheer for the many independent container companies struggling for survival, especially those receiving redelivered vessels, and even less for their bankers. In conclusion, it looks as though over the winter the market has finally passed the trough and is at last edging upwards. However the upturn has more to do with spikes generated by slow steaming logistics than a fundamental improvement in demand and supply trends. With ships strung out around the world, an uptick in cargo can easily find a shortage of ships at the loading zone, which soon disappears as owners reposition and speed up in order to take advantage of the higher rates which result. However, the good news is that at least surplus cargo transport capacity is no longer growing. 1.1 Freight Market Overview Tanker Earnings Avg. $/day Mar '13- Sep '13- % Aug '13 Feb '14 Change VLCC (c. 2010-built) 10,405 30,796 196.0% VLCC (c. 2000-built) 7,960 31,615 297.2% Suezmax (c. 2010-built) 13,895 26,022 87.3% Aframax (c. 2010-built) 14,005 23,261 66.1% Products (Dirty) 12,089 16,202 34.0% Products (Clean) 13,018 10,753 -17.4% Weighted Avg. 13,008 16,278 25.1% Bulkcarrier Earnings Avg. $/day Mar '13- Sep '13- % Aug '13 Feb '14 Change Capesize 9,488 23,554 148.2% Panamax (Spot) 1,316 4,971 277.8% Panamax (trip) 8,014 12,495 55.9% Handymax (52k) 8,697 11,794 35.6% Handysize (t/c) 7,639 9,573 25.3% Weighted Avg. 6,429 10,728 66.9% Containership Earnings Avg. $/day Mar '13- Sep '13- % Aug '13 Feb '14 Change 4,400 teu gls 9,033 7,792 -13.7% 3,500 teu gls 7,008 7,267 3.7% 2,500 teu gls 6,792 7,083 4.3% 2,000 teu gls 6,525 6,600 1.1% 1,700 teu grd 7,033 7,492 6.5% 1,000 teu grd 6,383 6,600 3.4% 725 teu grd 4,817 5,133 6.6% Weighted Avg. 6,313 6,565 4.0% Licensed to Shanghai Maritime University. Distribution is restricted; please remember to acknowledge the source. http://www.clarksons.net 15/09/2014 08:45:39 36122 Licensed to Shanghai Maritime University. Distribution is restricted; please remember to acknowledge the source. http://www.clarksons.net 15/09/2014 08:45:39 36122
SHIPPING MARKET OUTLOOK ClarkSea Index Tanker Average Spot Earnings 55 $,000/d 100 $ 000/d ■■■■■ 5 -Aframax Crude 90 Tankers 80 Handy Product 6E:S5:80 L02/60/9L lou suosxe'MM/dny Tankers (Clean) 40 70 53025 60 50 201 40 30 10 20 5 10 0 6 % 8 N m 寸 0 pL-ue Source: Clarkson Research Services Source:Clarkson Research Services Figure 1.1.1 Figure 1.1.2 Bulker Average Spot Earnings Containership Earnings Index 70 $,000/d 120 93=100 110 660550540530252016 100 90 80 70 60 Licensed to Shanghai Maritime University.Distribution is restricted:please remember to acknowledge the source.http://ww.clarksons.net 15/09/2014 08:45:39 36122 50 10 40 5 0 30 90-inr a 巴2三忘三点芳E 誉马名P Source:Clarkson Research Services Source:Clarkson Research Services Figure 1.1.3 Figure 1.1.4 Clarkson Research Services Spring 2014 9
Clarkson Research Services Spring 2014 9 SHIPPING MARKET OUTLOOK Figure 1.1.3 Figure 1.1.4 Figure 1.1.1 Figure 1.1.2 05 10 15 20 25 30 35 40 45 50 55 Jan-06 Jul-06 Jan-07 Jul-07 Jan-08 Jul-08 Jan-09 Jul-09 Jan-10 Jul-10 Jan-11 Jul-11 Jan-12 Jul-12 Jan-13 Jul-13 Jan-14 $ ,000/d Source: Clarkson Research Services ClarkSea Index 0 10 20 30 40 50 60 70 80 90 100 Jan-06 Jul-06 Jan-07 Jul-07 Jan-08 Jul-08 Jan-09 Jul-09 Jan-10 Jul-10 Jan-11 Jul-11 Jan-12 Jul-12 Jan-13 Jul-13 Jan-14 $ ,000/d Source: Clarkson Research Services Tanker Average Spot Earnings Aframax Crude Tankers Handy Product Tankers (Clean) 05 10 15 20 25 30 35 40 45 50 55 60 65 70 Jan-06 Jul-06 Jan-07 Jul-07 Jan-08 Jul-08 Jan-09 Jul-09 Jan-10 Jul-10 Jan-11 Jul-11 Jan-12 Jul-12 Jan-13 Jul-13 Jan-14 $ ,000/d Source: Clarkson Research Services Bulker Average Spot Earnings 30 40 50 60 70 80 90 100 110 120 Jan-06 Jul-06 Jan-07 Jul-07 Jan-08 Jul-08 Jan-09 Jul-09 Jan-10 Jul-10 Jan-11 Jul-11 Jan-12 Jul-12 Jan-13 Jul-13 Jan-14 '93 = 100 Source: Clarkson Research Services Containership Earnings Index Licensed to Shanghai Maritime University. Distribution is restricted; please remember to acknowledge the source. http://www.clarksons.net 15/09/2014 08:45:39 36122 Licensed to Shanghai Maritime University. Distribution is restricted; please remember to acknowledge the source. http://www.clarksons.net 15/09/2014 08:45:39 36122

SHIPPING MARKET OUTLOOK 1.2 World Economy Sea Trade in 2015 (see table opposite).So overall,the "bounce back"in the OECD economies should Six months ago,we thought that the industrial be helpful in 2014. business cycle was bottoming out and things might be better over the coming year.Broadly In the non-OECD countries,the Chinese speaking,this turned out to be the case.In economy has slowed somewhat,but continues spring 2013,world industrial production briefly as the lead driving force in the marine market. moved into negative growth,driven by the euro Industrial production has fallen from 13.7% area crisis and weak growth in the other OECD growth in 2011 to 8.6%growth in the year to icensed to Shanghal #10216031 economies.But momentum picked up over the February 2014.Since the new leadership came summer,and by January 2014 OECD industrial into office last year,changes are taking place, production was growing at 3.8%pa.Currently including a determination to clamp down on the global economic forecasts are positive,with corruption and a changing focus of economic industrial output expected to grow by 4%in activity.China is no longer the super cheap 2014 and world GDP by 3.7%(see table 1.1 manufacturer to the world that it was 10 years Maritime Uriversity opposite).So from this perspective,after a ago.But it has large and growing consumer difficult year in 2013,the shipping industry markets.Iron ore imports continue their moves into 2014 with the prospect of better upward trajectory,and over the last two years support from the world economy.But the risks this has been reinforced by rapidly growing remain.The north Atlantic banking crisis has imports of coal and nonferrous metal ores.This Dis tribution is still not been resolved and there is the diversification is welcome for the bulk shipping potentially destabilising effect of recent industry.The main worry is the underlying developments in the Black Sea. health of the property market,the most likely source of future problems. From the OECD perspective,the good news is plea that the euro area economies are now "back in Meanwhile,the other Asian countries have not the black".In the fourth quarter of 2013,the fared so well.The industrial production of euro zone finally registered positive growth of Asia,excluding China and Japan,slumped from 0.5%,leaving GDP at year end in roughly the 6%growth in January 2013 to a 1.2%decline in remember to same place it started,but on an upward trend. January 2014.In January 2014,India's The current forecast is for sluggish GDP growth industrial production was only 0.1%higher than of 1.3%in 2014 and 1.6%in 2015.Since the a year earlier and in several other Asian euro area remains one of the largest maritime economies production was down.But the trading regions,this modest growth is at least general prospect is for a turnaround in 2014. an improvement. On balance,the economic outlook for 2014 and the sourde. The economic turnaround in the United States 2015 seems reasonably positive.The GDP is also gathering pace,helped by the housing projections in table 1.1 opposite show global market and the energy markets,which have growth gathering pace over the next two years, transformed the USA's energy balance from driven by a turnaround in the north Atlantic http://ww. decline to seemingly abundant supplies of and,hopefully,stronger growth in Asian relatively cheap natural gas and oil.The economies.Translating that into seaborne trade, business cycle bottomed out at 1.9%GDP the forecast is"steady as she goes".Projections growth in 2013,and GDP is predicted to grow in the table opposite show dry bulk trade at2.8%in2014and3.0%in2015 growing at 4.3%in 2014;the oil trade at 2.1%; and the container trade at 6.0%.That would Japan and South Korea,two other major OECD provide a solid platform for bringing the economies,picked up strongly in 2013. maritime economy closer to balance.But the Currently the forecasts for Japan over the next risks in China and the Black Sea remain.Also it two years are more muted,with 1.7%growth is six years since the last crisis,so care is .2218303:54:80410299051ci projected for 2014 and slightly less in 2015. needed to protect investments from one of those But the projections for South Korea are much economic shocks which have a habit of popping more robust,showing 3.7%in 2014 and 4.0% up every seven or eight years. Clarkson Research Services 10 Spring 2014
Clarkson Research Services 10 Spring 2014 SHIPPING MARKET OUTLOOK Six months ago, we thought that the industrial business cycle was bottoming out and things might be better over the coming year. Broadly speaking, this turned out to be the case. In spring 2013, world industrial production briefly moved into negative growth, driven by the euro area crisis and weak growth in the other OECD economies. But momentum picked up over the summer, and by January 2014 OECD industrial production was growing at 3.8% pa. Currently the global economic forecasts are positive, with industrial output expected to grow by 4% in 2014 and world GDP by 3.7% (see table 1.1 opposite). So from this perspective, after a difficult year in 2013, the shipping industry moves into 2014 with the prospect of better support from the world economy. But the risks remain. The north Atlantic banking crisis has still not been resolved and there is the potentially destabilising effect of recent developments in the Black Sea. From the OECD perspective, the good news is that the euro area economies are now “back in the black”. In the fourth quarter of 2013, the euro zone finally registered positive growth of 0.5%, leaving GDP at year end in roughly the same place it started, but on an upward trend. The current forecast is for sluggish GDP growth of 1.3% in 2014 and 1.6% in 2015. Since the euro area remains one of the largest maritime trading regions, this modest growth is at least an improvement. The economic turnaround in the United States is also gathering pace, helped by the housing market and the energy markets, which have transformed the USA’s energy balance from decline to seemingly abundant supplies of relatively cheap natural gas and oil. The business cycle bottomed out at 1.9% GDP growth in 2013, and GDP is predicted to grow at 2.8% in 2014 and 3.0% in 2015. Japan and South Korea, two other major OECD economies, picked up strongly in 2013. Currently the forecasts for Japan over the next two years are more muted, with 1.7% growth projected for 2014 and slightly less in 2015. But the projections for South Korea are much more robust, showing 3.7% in 2014 and 4.0% in 2015 (see table opposite). So overall, the “bounce back” in the OECD economies should be helpful in 2014. In the non-OECD countries, the Chinese economy has slowed somewhat, but continues as the lead driving force in the marine market. Industrial production has fallen from 13.7% growth in 2011 to 8.6% growth in the year to February 2014. Since the new leadership came into office last year, changes are taking place, including a determination to clamp down on corruption and a changing focus of economic activity. China is no longer the super cheap manufacturer to the world that it was 10 years ago. But it has large and growing consumer markets. Iron ore imports continue their upward trajectory, and over the last two years this has been reinforced by rapidly growing imports of coal and nonferrous metal ores. This diversification is welcome for the bulk shipping industry. The main worry is the underlying health of the property market, the most likely source of future problems. Meanwhile, the other Asian countries have not fared so well. The industrial production of Asia, excluding China and Japan, slumped from 6% growth in January 2013 to a 1.2% decline in January 2014. In January 2014, India’s industrial production was only 0.1% higher than a year earlier and in several other Asian economies production was down. But the general prospect is for a turnaround in 2014. On balance, the economic outlook for 2014 and 2015 seems reasonably positive. The GDP projections in table 1.1 opposite show global growth gathering pace over the next two years, driven by a turnaround in the north Atlantic and, hopefully, stronger growth in Asian economies. Translating that into seaborne trade, the forecast is “steady as she goes”. Projections in the table opposite show dry bulk trade growing at 4.3% in 2014; the oil trade at 2.1%; and the container trade at 6.0%. That would provide a solid platform for bringing the maritime economy closer to balance. But the risks in China and the Black Sea remain. Also it is six years since the last crisis, so care is needed to protect investments from one of those economic shocks which have a habit of popping up every seven or eight years. 1.2 World Economy & Sea Trade Licensed to Shanghai Maritime University. Distribution is restricted; please remember to acknowledge the source. http://www.clarksons.net 15/09/2014 08:45:39 36122 Licensed to Shanghai Maritime University. Distribution is restricted; please remember to acknowledge the source. http://www.clarksons.net 15/09/2014 08:45:39 36122