Network Design Tools: Major Components Mapping Mapping allows you to visualize your supply chain and solutions Mapping the solutions allows you to better understand different scenarios Color coding,sizing,and utilization indicators allow for further analysis Data Data specifies the costs of your supply chain The baseline cost data should match your accounting data The output data allows you to quantify changes to the supply chain Engine Optimization Techniques
Network Design Tools: Major Components Mapping Mapping allows you to visualize your supply chain and solutions Mapping the solutions allows you to better understand different scenarios Color coding, sizing, and utilization indicators allow for further analysis Data Data specifies the costs of your supply chain The baseline cost data should match your accounting data The output data allows you to quantify changes to the supply chain Engine Optimization Techniques
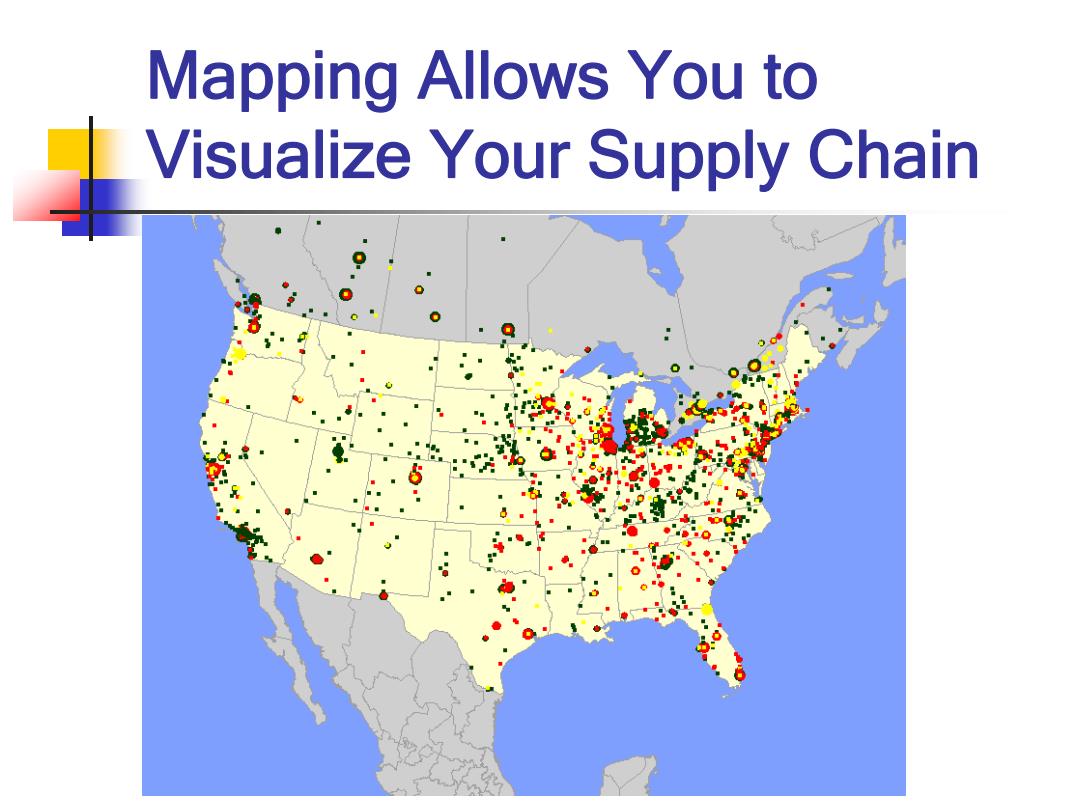
Mapping Allows You to Visualize Your Supply Chain
Mapping Allows You to Visualize Your Supply Chain
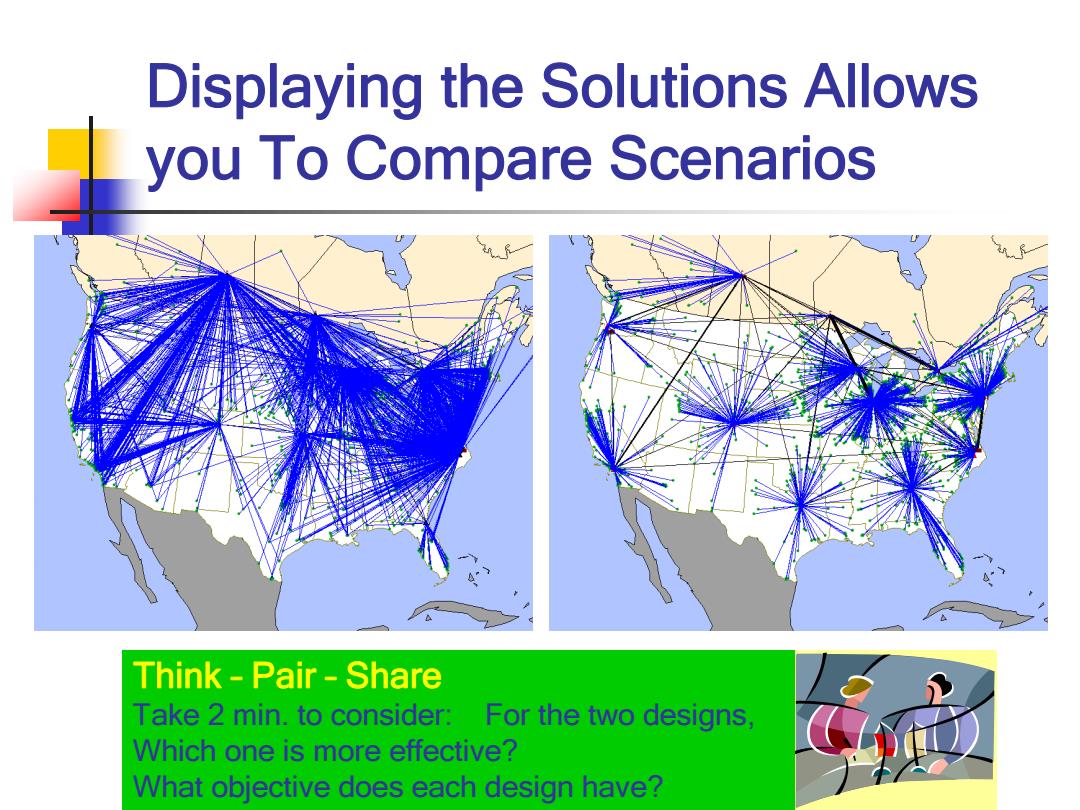
Displaying the Solutions Allows you To Compare Scenarios Think-Pair-Share Take 2 min.to consider: For the two designs, Which one is more effective? What objective does each design have?
Displaying the Solutions Allows you To Compare Scenarios Think – Pair – Share Take 2 min. to consider: For the two designs, Which one is more effective? What objective does each design have?
Data for Network Design 1.A listing of all products 2.Location of customers,stocking points and sources 3.Demand for each product by customer location 4.Transportation rates 5.Warehousing costs 6.Shipment sizes by product 7.Order patterns by frequency,size,season,content 8.Order processing costs 9.Customer service goals
Data for Network Design 1. A listing of all products 2. Location of customers, stocking points and sources 3. Demand for each product by customer location 4. Transportation rates 5. Warehousing costs 6. Shipment sizes by product 7. Order patterns by frequency, size, season, content 8. Order processing costs 9. Customer service goals
Too Much Information The amount of data involved in any optimization model is overwhelming The first step is data aggregation. Customers are aggregated using a grid network or other clustering techniques. Items are aggregated into a reasonable number of product groups. data aggregation:数据汇集
Too Much Information The amount of data involved in any optimization model is overwhelming. The first step is data aggregation. Customers are aggregated using a grid network or other clustering techniques. Items are aggregated into a reasonable number of product groups. data aggregation:数据汇集