计算机问题求解一论题2-8 -概率分析与随机算法 2016年04月14日
计算机问题求解 – 论题2-8 - 概率分析与随机算法 2016年04月14日
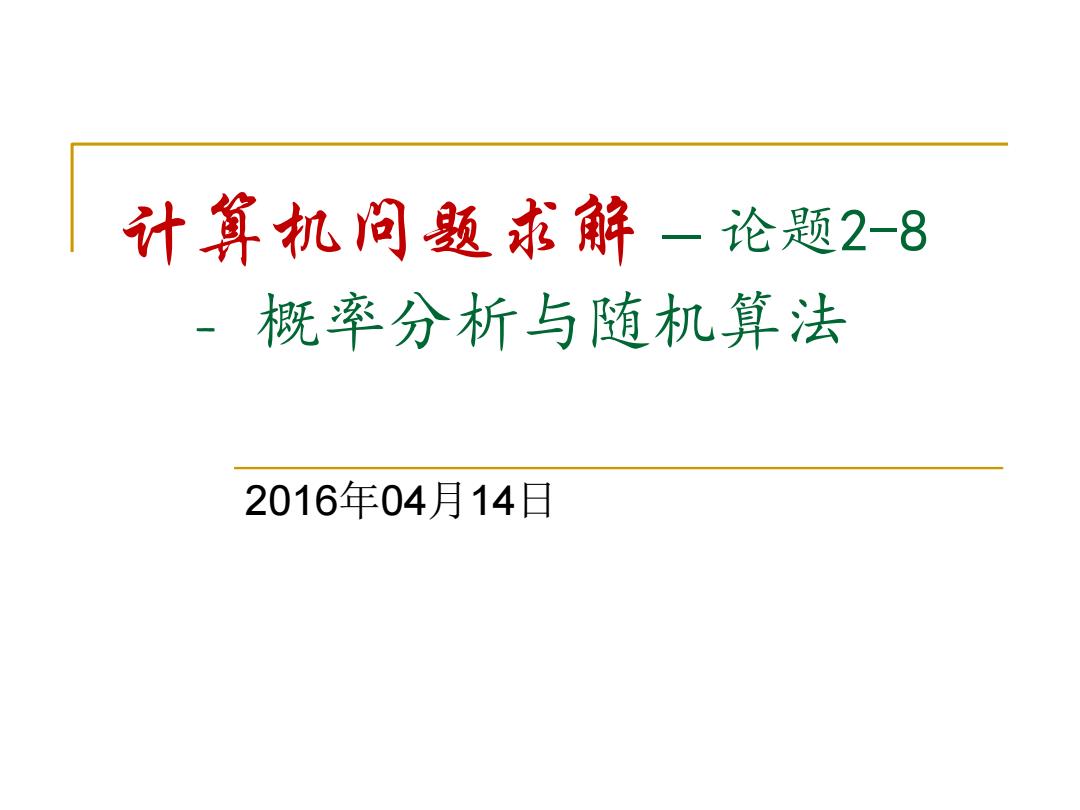
.30 25 Histogram for 10 .20- flips of a coin 1 10 .05 0 0 1 23456789 10 Number of Heads 问题: 你能否结合这个图解释与随机变量相关的以 下的标念:期望值、分布以及它们之间的关系?
Histogram for 10 flips of a coin
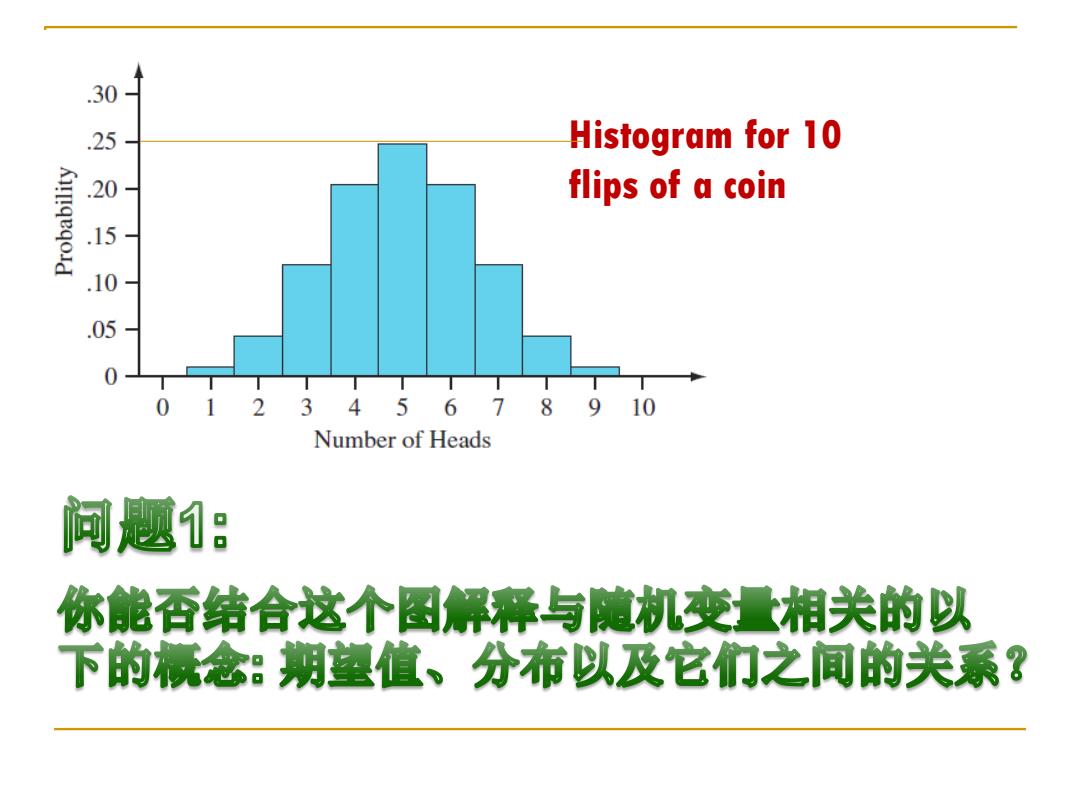
Histogram for answers for a 10-problem test 35 .30 .25 问题2 .20 .15 .10 图中纵坐标值是 .05 0 012345678910 怎台得出来的? Number of Right Answers 贝努利试验过程: P(exactly k successes)= (p1-p- 当k=8, 0.88.0.22≈0.302
Histogram for answers for a 10-problem test 贝努利试验过程: 当k=8, 0.8 0.2 0.302 8 10 8 2
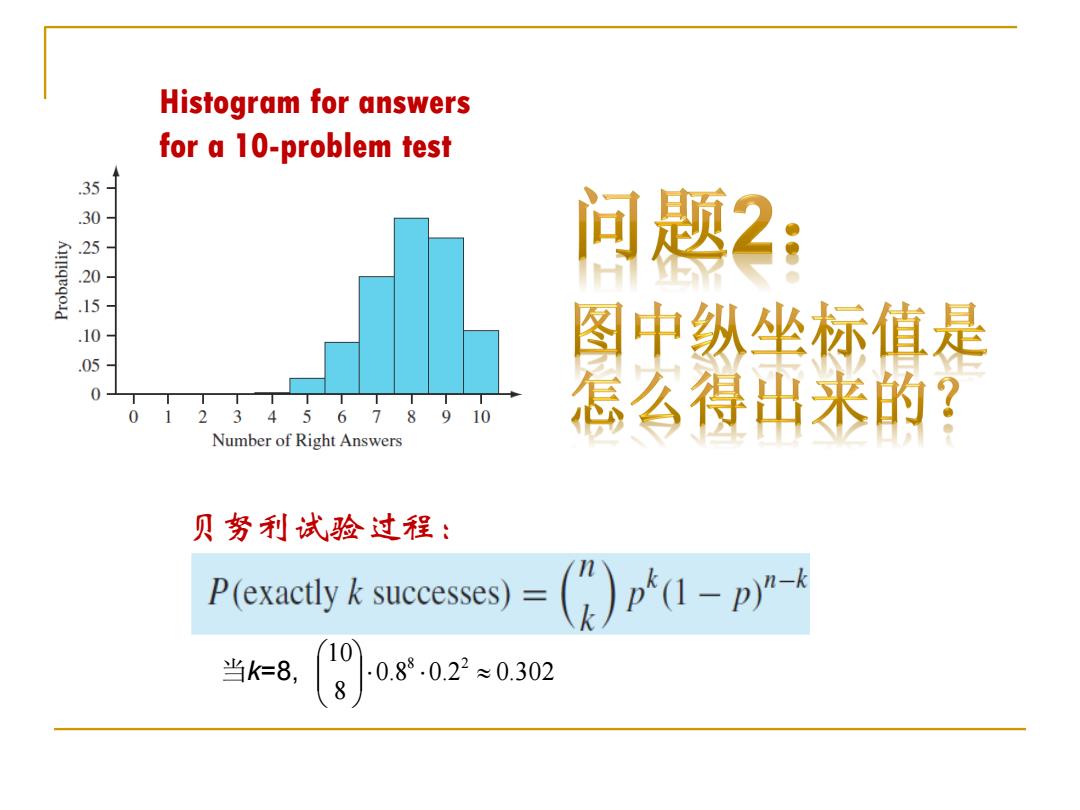
HIRE-ASSISTANT (n) best 0 /candidate 0 is a least-qualified dummy candidate 2 for i 1 to n 3 interview candidate i 4 if candidate i is better than candidate best 5 best i 6 hire candidate i 那么,有没有问: 般情况下,代价 问题3: 会如何? 这个算法是“确定”的吗? 什么是“随机”的呢? 它的best和worst case是什么?
那么,有没有问: 一般情况下,代价 会如何?
Average-Case Analysis of Algorithms We focus on computing the runing time of various algorithms When the running time of an algorithm is different for different inputs of the same size,we can think of the running time of the algorithm as a random variable on the sample space of inputs,and thus,we can analyze the expected running time of the algorithm.This gives us an understanding different from studying just the worst-case runing time for an input of a given size
Average-Case Analysis of Algorithms