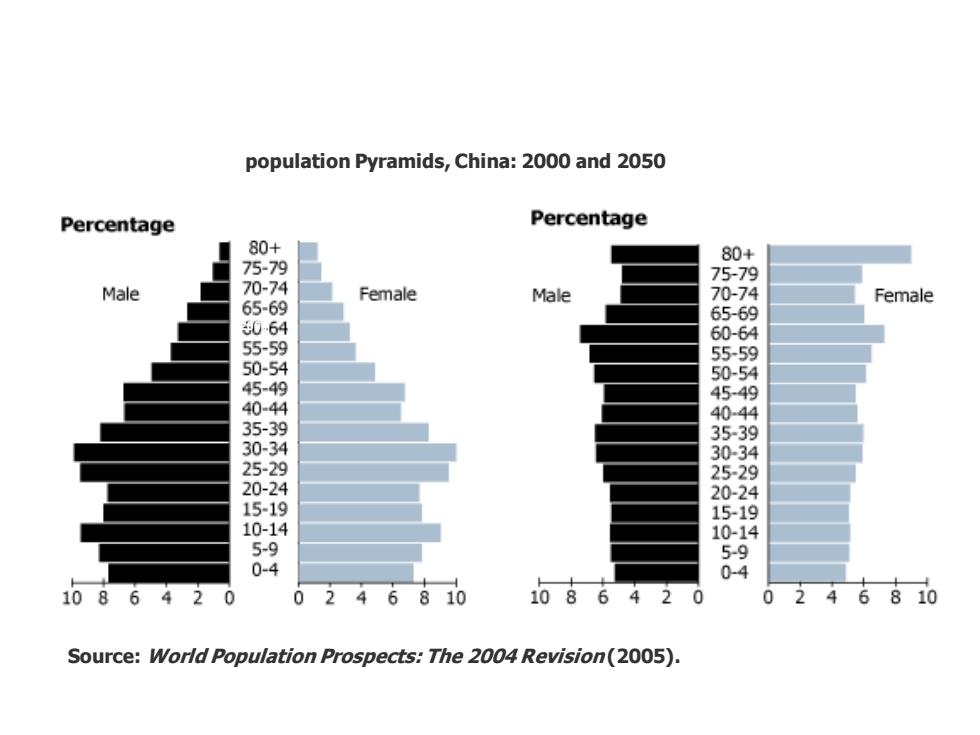
population Pyramids,China:2000 and 2050 Percentage Percentage 80+ 80+ 75-79 75-79 Male 70-74 Female Male 70-74 Female 65-69 6569 064 60 64 55-59 55-59 50-54 50-54 45-49 45-49 40-44 40-44 35-39 35-39 30-34 30-34 25-29 25-29 20-24 20-24 15-19 15-19 10-14 10-14 5-9 59 0-4 0-4 1086420 0246810 1086420 0246810 Source:World Population Prospects:The 2004 Revision(2005)
population Pyramids, China: 2000 and 2050 2000 2050 Source: World Population Prospects: The 2004 Revision (2005)
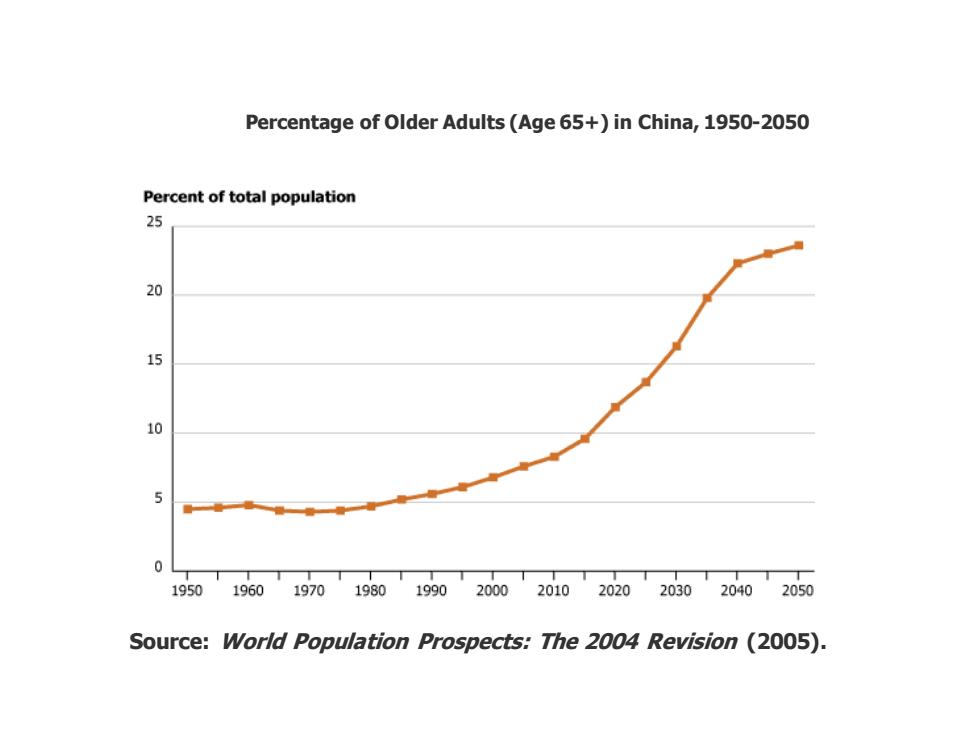
Percentage of Older Adults(Age 65+)in China,1950-2050 Percent of total population 25 20 15 10 5 0 1950 196019701980199020020102020203020402050 Source:World Population Prospects:The 2004 Revision (2005)
Percentage of Older Adults (Age 65+) in China, 1950-2050 Source: World Population Prospects: The 2004 Revision (2005)