Presenting tables and figures Tables present numbers or text in Tables columns,each having a title or label. Figures are visual presentations of Figures results,including graphs,diagrams, photos,drawings,schematics,maps,etc
Presenting tables and figures Tables Tables present numbers or text in columns, each having a title or label. Figures Figures are visual presentations of results, including graphs, diagrams, photos, drawings, schematics, maps, etc
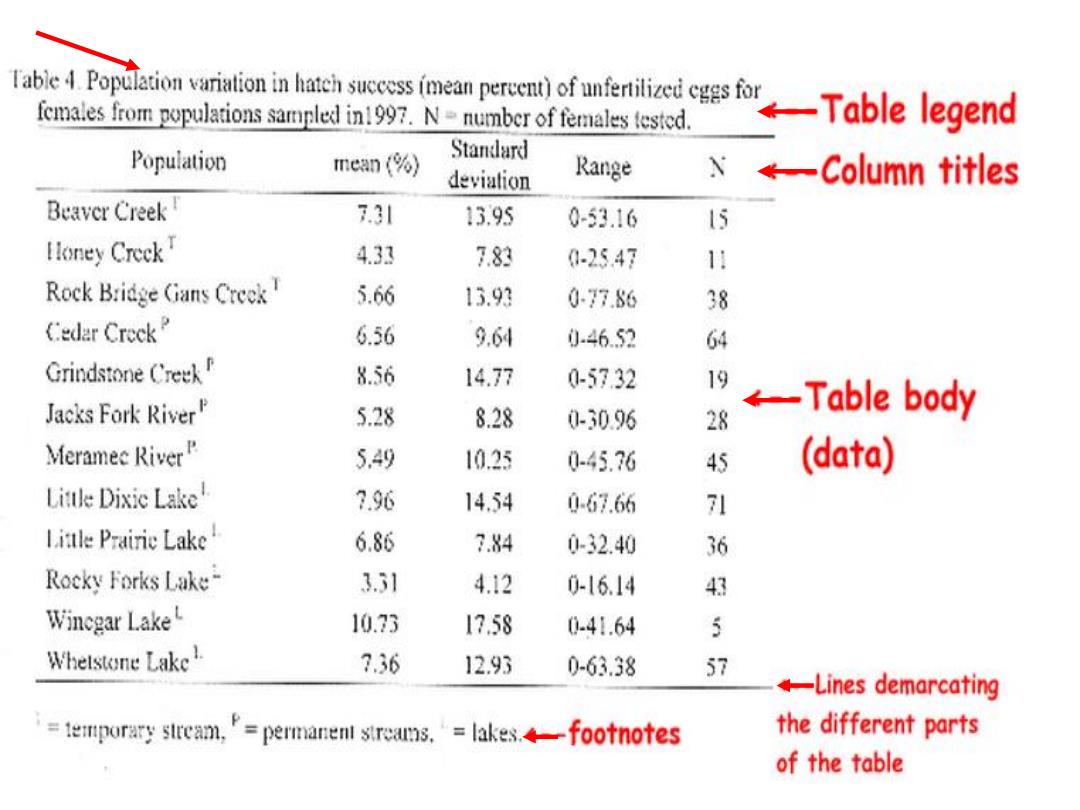
Iabc4PtieionvwniationinlaiemsseosfoeanprerecrwWofunfenizcdcgsfor。←-Tablelegend females from populations sampled in1997.Nnumber of females tested. Population mean(%) Standard deviation Range N←一Column titles Beaver Creek 7.31 13.95 0-53.16 15 Ioney Creck 4.33 7.83 0-25.47 11 Rock Bridge (ians Creck 5.66 13.93 0-77.86 38 Cedar Creck 6.56 9.64 0-46.52 64 Grindstone Creek 8.56 14.77 0-57.32 19 Jacks Fork River 5.28 8.28 ←-Table body 0-3096 28 Meramec RiverP 5.49 10.25 0-45.76 45 (data) Little Dixic Lake 7.96 14.54 0-67.66 71 Litle Prairie Lake 6.86 7.84 0-32.40 36 Rocky Forks Lake- 3.31 4.12 0-16.14 43 Wincgar Lake 10.23 17.58 0-41.64 5 Whetstone Lake 7.36 1293 0-63.38 57 -Lines demarcating =temporary sircam,"permanent streams.lakes.-footnotes the different parts of the table
Company name www.themegaller y.com
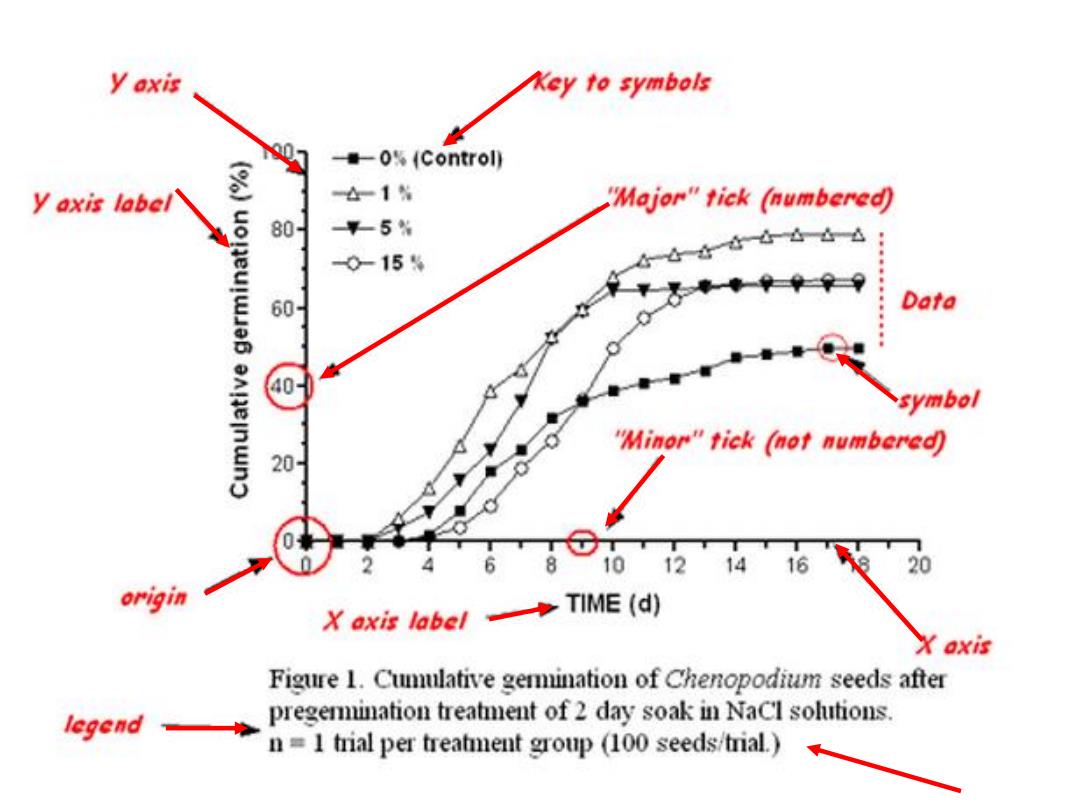
y axis Key to symbols -0%(Control) y axis label 合1% "Major"tick (numbered) 80- 平5% 0-154 60 Data symbol "Minor"tick (not numbered) 20- 10 1214 16 20 X axis label◆l TIME (d) Figure 1.Cumulative germination of Chenopodium seeds after legend pregermiination treatment of 2 day soak in NaCl solutions. n=1 trial per treatment group (100 seeds/trial.)
Company name www.themegaller y.com
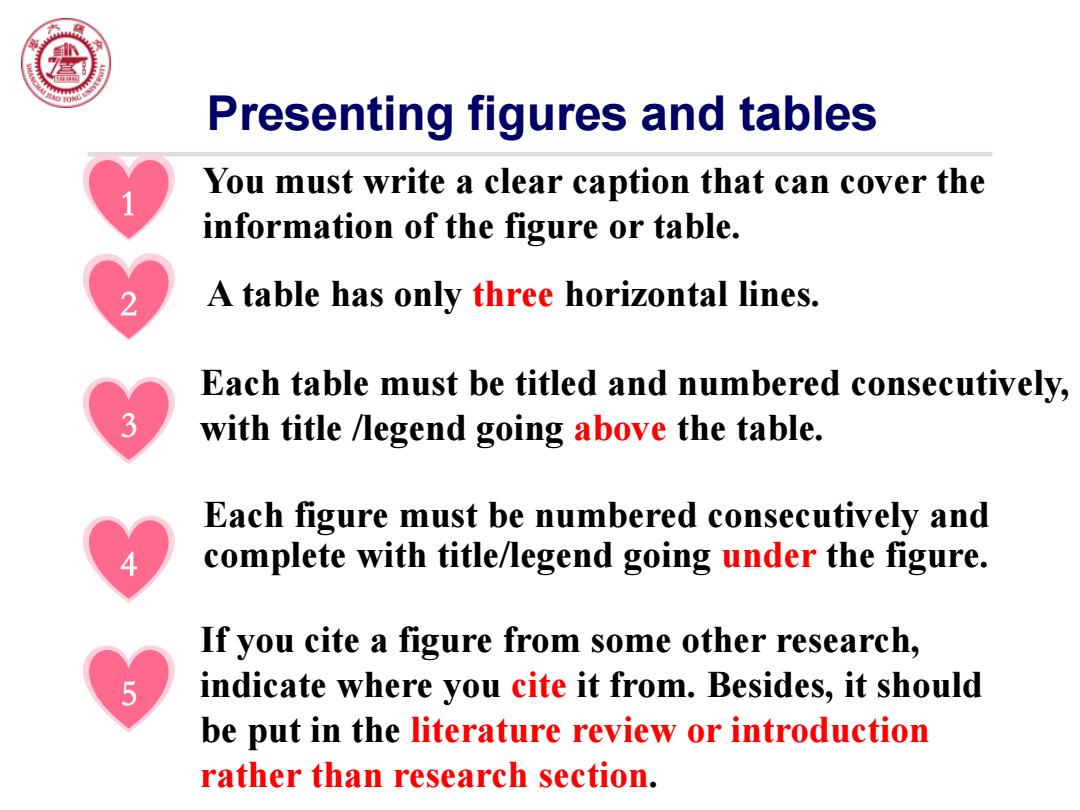
Presenting figures and tables You must write a clear caption that can cover the information of the figure or table. A table has only three horizontal lines. Each table must be titled and numbered consecutively, with title /legend going above the table. Each figure must be numbered consecutively and complete with title/legend going under the figure. If you cite a figure from some other research, indicate where you cite it from.Besides,it should be put in the literature review or introduction rather than research section
Presenting figures and tables A table has only three horizontal lines. Each table must be titled and numbered consecutively, with title /legend going above the table. Each figure must be numbered consecutively and 4 complete with title/legend going under the figure. 3 If you cite a figure from some other research, indicate where you cite it from. Besides, it should be put in the literature review or introduction rather than research section. 5 1 2 You must write a clear caption that can cover the information of the figure or table