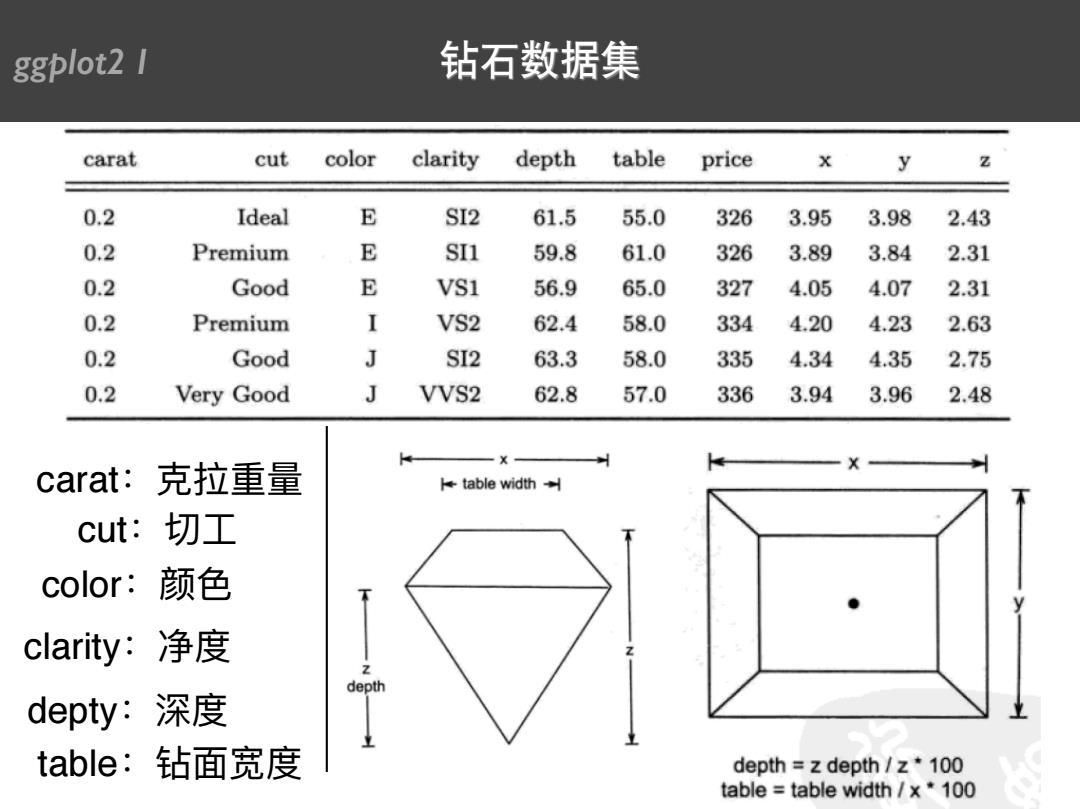
ggplot2 I 钻石数据集 carat cut color clarity depth table price y 0.2 Ideal E SI2 61.5 55.0 326 3.95 3.98 2.43 0.2 Premium E SI1 59.8 61.0 326 3.89 3.84 2.31 0.2 Good E VS1 56.9 65.0 327 4.05 4.07 2.31 0.2 Premium I VS2 62.4 58.0 334 4.20 4.23 2.63 0.2 Good J SI2 63.3 58.0 335 4.34 4.35 2.75 0.2 Very Good J VVS2 62.8 57.0 336 3.94 3.96 2.48 carat:克拉重量 table width cut:切工 color:颜色 clarity:净度 depth depty:深度 table:钻面宽度 depth z depth /z*100 table table width /x*100
caratғظ᯿ᰁ cutғڔૡ colorғ᷏ᜋ clarityғٳଶ deptyғႮଶ tableғ᱂ᶎ਼ଶ ggplot2 I 钻石数据集
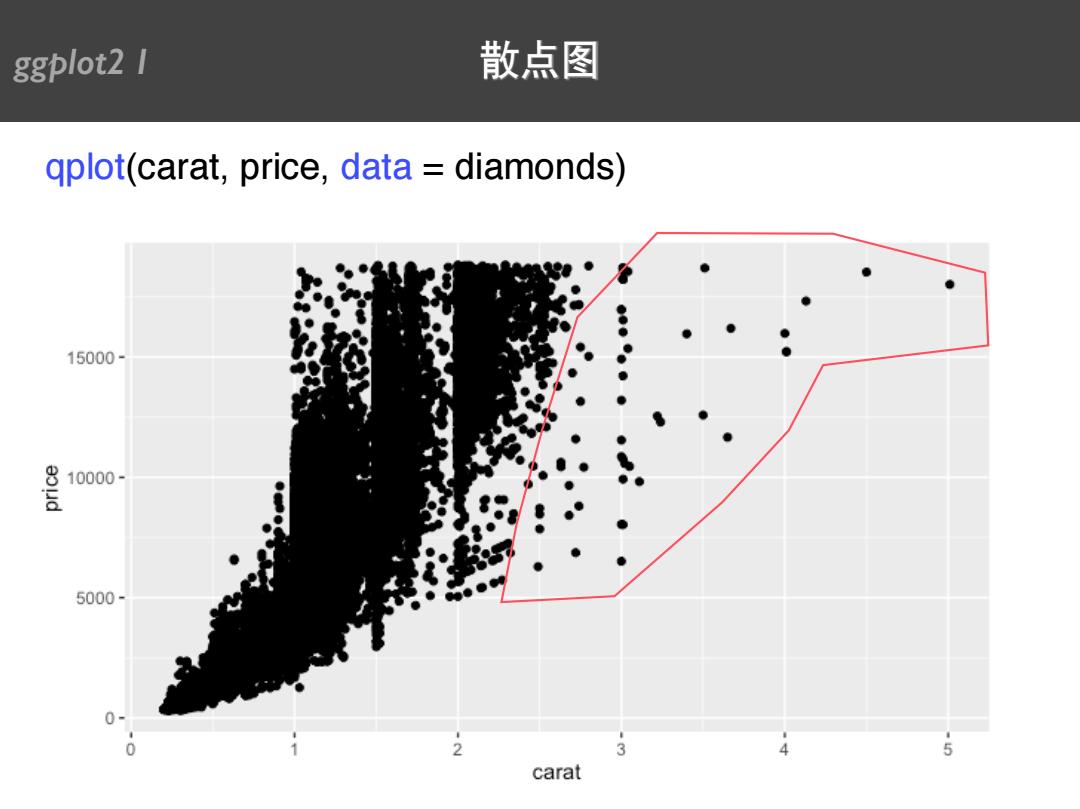
ggplot2 1 散点图 qplot(carat,price,data diamonds) 15000- 10000- 5000- 0- 0 2 3 5 carat
qplot(carat, price, data = diamonds) ggplot2 I 散点图
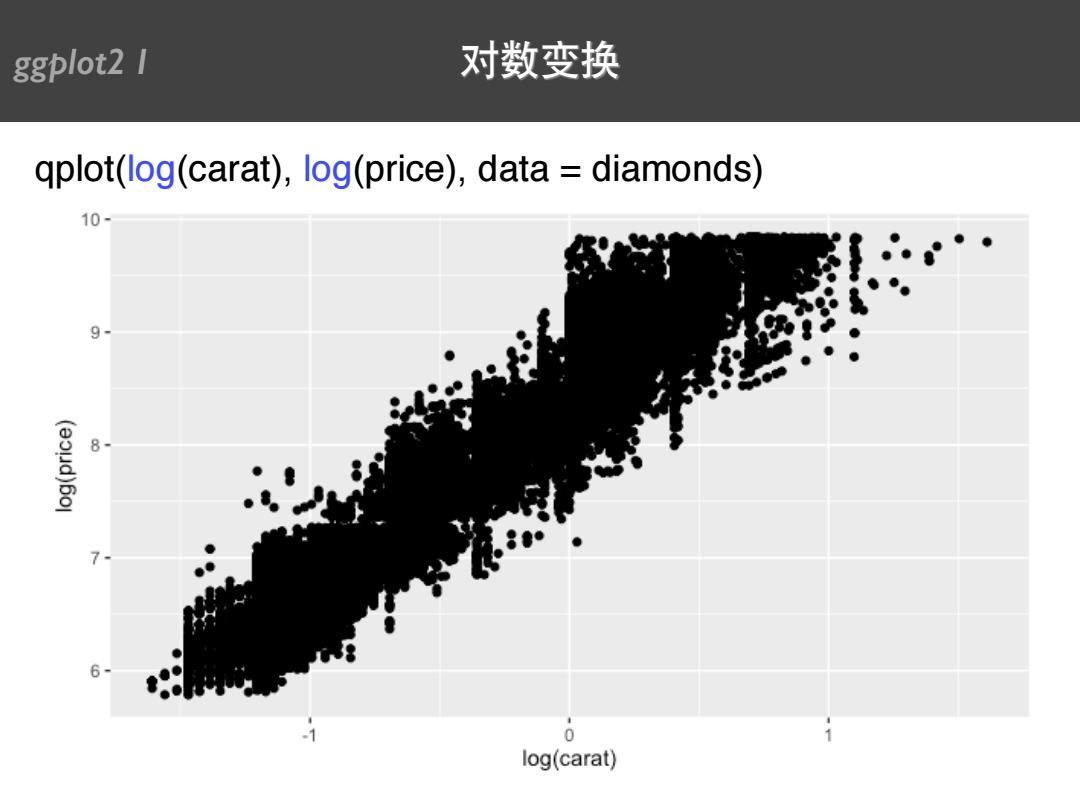
ggplot2 1 对数变换 qplot(log(carat),log(price),data diamonds) 10 91 (aoud)6o1 -1 0 log(carat)
qplot(log(carat), log(price), data = diamonds) ggplot2 I 对数变换
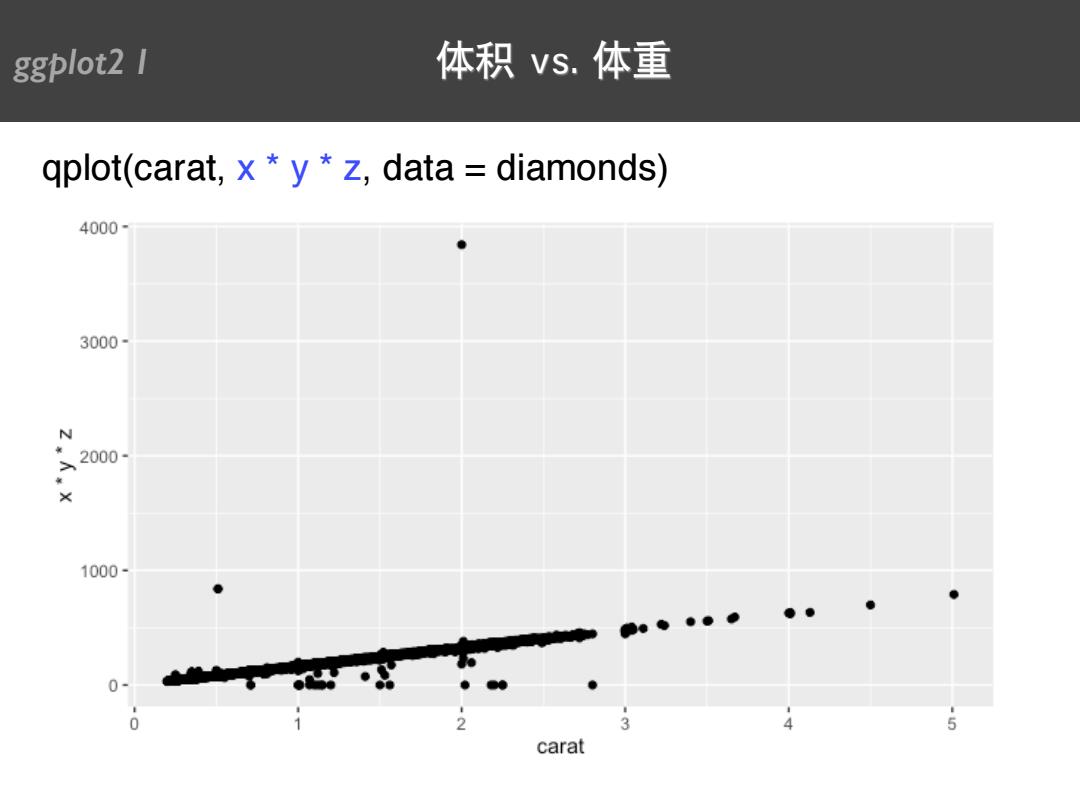
ggplot2 1 体积vs.体重 qplot(carat,x *y z,data diamonds) 4000- 3000- N 2000- × 1000- ●● ●● 0- 0 4 5 carat
qplot(carat, x * y * z, data = diamonds) ggplot2 I 体积 vs. 体重
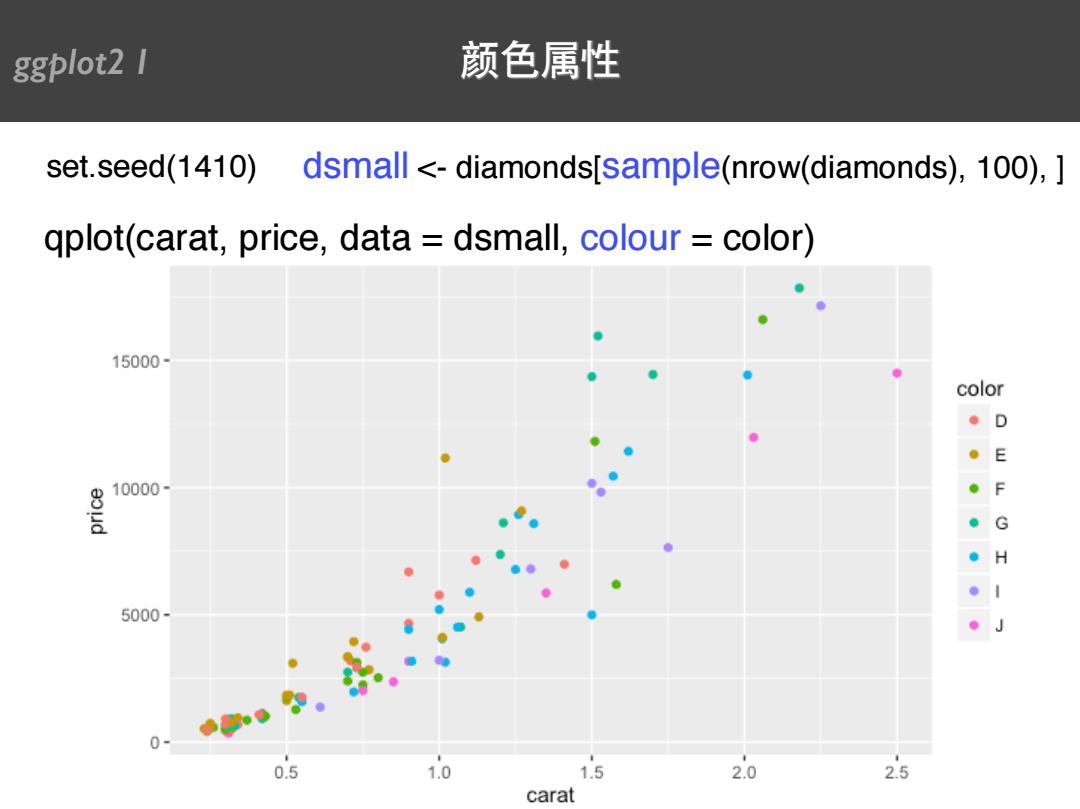
ggplot2 1 颜色属性 set.seed(1410) dsmall <diamonds[sample(nrow(diamonds),100), qplot(carat,price,data dsmall,colour color) 15000- color D ·E 10000- 。F G H 5000- 0 0.5 1.0 1.5 2.0 2.5 carat
qplot(carat, price, data = dsmall, colour = color) set.seed(1410) dsmall <- diamonds[sample(nrow(diamonds), 100), ] ggplot2 I 颜色属性