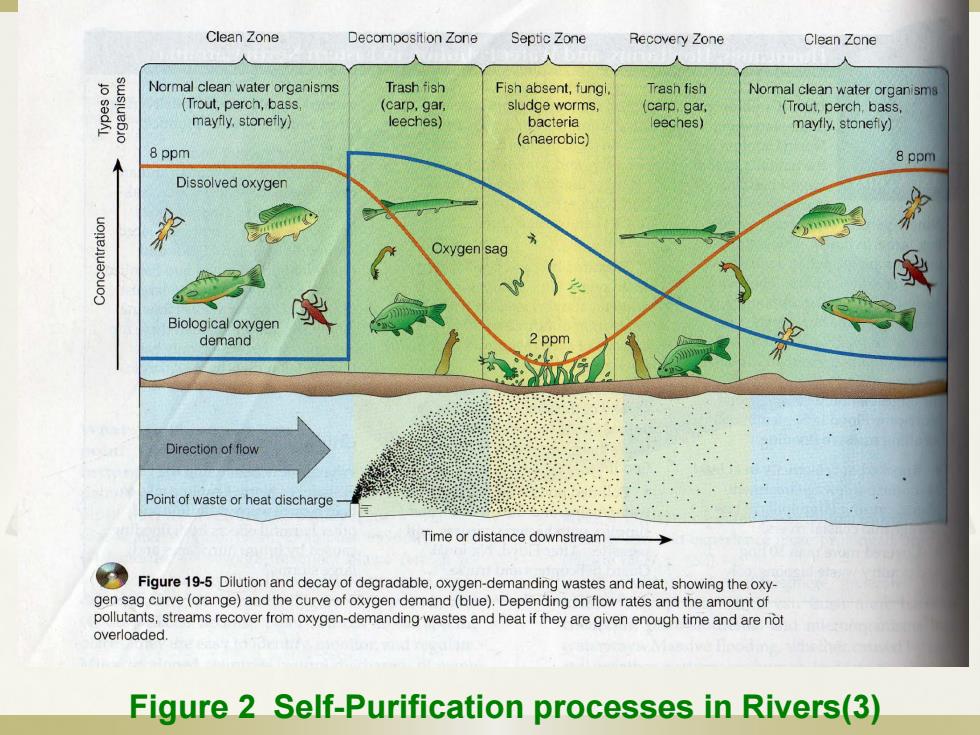
Clean Zone Decomposition Zone Septic Zone Recovery Zone Clean Zone 人 人 人 Normal clean water organisms Trash fish Fish absent,fungi Trash fish Normal clean water organisms (Trout,perch,bass (carp,gar sludge worms carp,gar (Trout,perch,bass mayfly.stonefly) leeches) bacteria eeches) mayfly,stonefy) (anaerobic) 8 ppm 8 ppm Dissolved oxygen Oxygensag Biological oxygen demand 2 ppm Direction of flow Point of waste or heat discharge- Time or distance downstream-> Figure19-Diltion and decay of degradable.oxygen-demanding wastes and heatinhxy gen sag curve(orange)and the curve of oxygen demand(blue).Depending on flow rates and the amount of pollutants,streams recover from oxygen-demanding wastes and heat if they are given enough time and are not overloaded. Figure 2 Self-Purification processes in Rivers(3)
Figure 2 Self-Purification processes in Rivers(3)
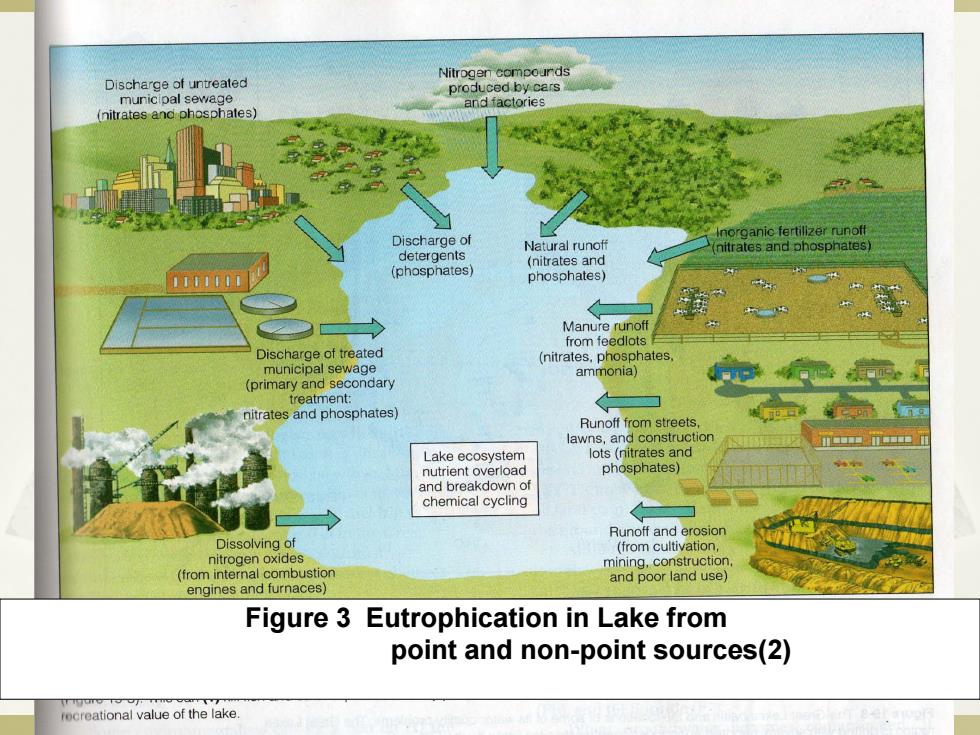
Discharge of untreated Nitrogen compounds produced by cars municlpal sewage and factories (nitrates and phosphates) norganic fertilizer runoff Discharge of Natural runoff detergents (nitrates and phosphates) (nitrates and (phosphates) phosphates) 义 Manure runoff from teedlots Discharge of treated (nitrates,phosphates municipal sewage (primary and secondary ammonia) 和湿通复 treatment: nitrates and phosphates) 而司 Runoff from streets lawns,and construction m中7 Lake ecosystem lots(nitrates and nutrient overload phosphates) and breakdown of chemical cycling Runoff and erosion Dissolving of (from cultivation, nitrogen oxides mining,construction (from internal combustior and poor land use】 engines and furnaces) Figure 3 Eutrophication in Lake from point and non-point sources(2) rcreational value of the lake
3 Figure 3 Eutrophication in Lake from point and non-point sources(2)

Figure 4 Groundwater contamination Hazardous w injection wll Coal strip Deicing road sall mine runoff Buried gasoline and solvent tanl Gasoline station Cesspool septic tan Water Waste lagoon pumping wel Accidental Leakag casing r aq Discharge Unconfined freshwate Confined aquifer Confined freshwater aquifer Groundwater flow
Figure 4 Groundwater contamination
Climate Change and Water Pollution Climate change-global warming projections include change in precipitation that implicates great change in distribution patterns in the world,too much rain in some areas and too little rain in other areas can increase the risk of water pollution. More intense rainfall can flush more harmful chemicals, plant nutrients,and microorganisms into waterways. Massive flooding can spread disease carrying pathogens by contaminating water supply facilities and wells,and cause lagoons that store animal and other wastes,as well as sewerages that carry both sewer and storm runoff,to overflow and release pollutants into streams
Climate Change and Water Pollution Climate change—global warming projections include change in precipitation that implicates great change in distribution patterns in the world, too much rain in some areas and too little rain in other areas can increase the risk of water pollution. More intense rainfall can flush more harmful chemicals, plant nutrients, and microorganisms into waterways. Massive flooding can spread disease carrying pathogens by contaminating water supply facilities and wells, and cause lagoons that store animal and other wastes, as well as sewerages that carry both sewer and storm runoff, to overflow and release pollutants into streams
Climate Change and Water Pollution Prolonged drought can reduce river flows that assimilates and dilutes wastes. Warmer water temperatures can threaten aquatic ecosystems by reducing dissolved oxygen(DO) levels,and increase the growth of harmful bacteria,and Many other pollution damage
Climate Change and Water Pollution Prolonged drought can reduce river flows that assimilates and dilutes wastes. Warmer water temperatures can threaten aquatic ecosystems by reducing dissolved oxygen (DO) levels, and increase the growth of harmful bacteria, and Many other pollution damage