
上游充通大 Variations of the Earth's surface temperature for... Departures in temperature in "C (from the 1961-1990 average) 08- 08 the past 140 years(global) 04 04 0.0 00 04 -04 Direct temperatures 08 -08 1860 1880 1900 1g20 1940 1960 1960 2000 Departures in temperature inC(from the 1961-1990 average) 08 08 the past 1000 years(Northern Hemisphere) 0.4 0.4 0.0 00 04 04 08 -08 SYR-FIGURE 2-3 Direct temperatures Proxy data 1000 1200 1400 1600 1800 2000 IPCC WMO UNEP INTERGOVERNMENTAL PANEL ON CLIMATE CHANGE 地球表面温度变化
地球表面温度变化
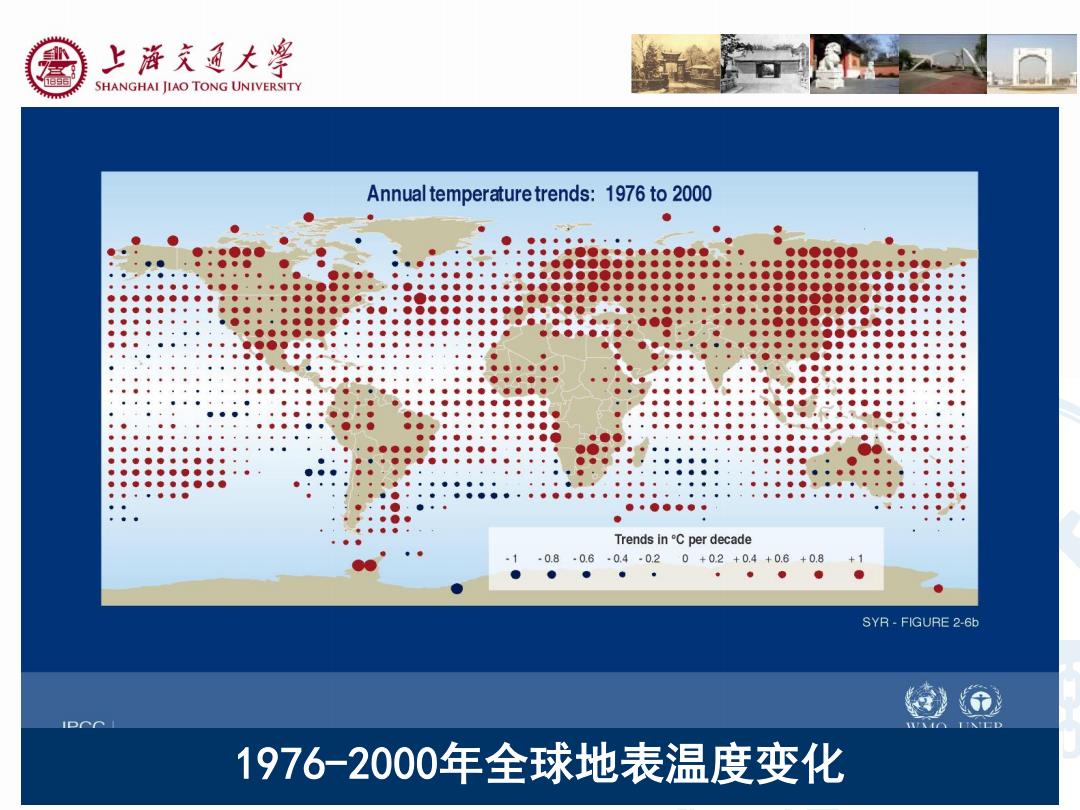
上游充通大¥ SHANGHAI JIAO TONG UNIVERSITY Annual temperature trends:1976 to 2000 ● Trends inC per decade 1 -0.8.0.6.0.4-0.20+02+0.4+0.6+0.8 +1 ● SYR-FIGURE 2-6b 1976-2000年全球地表温度变化
1976-2000年全球地表温度变化
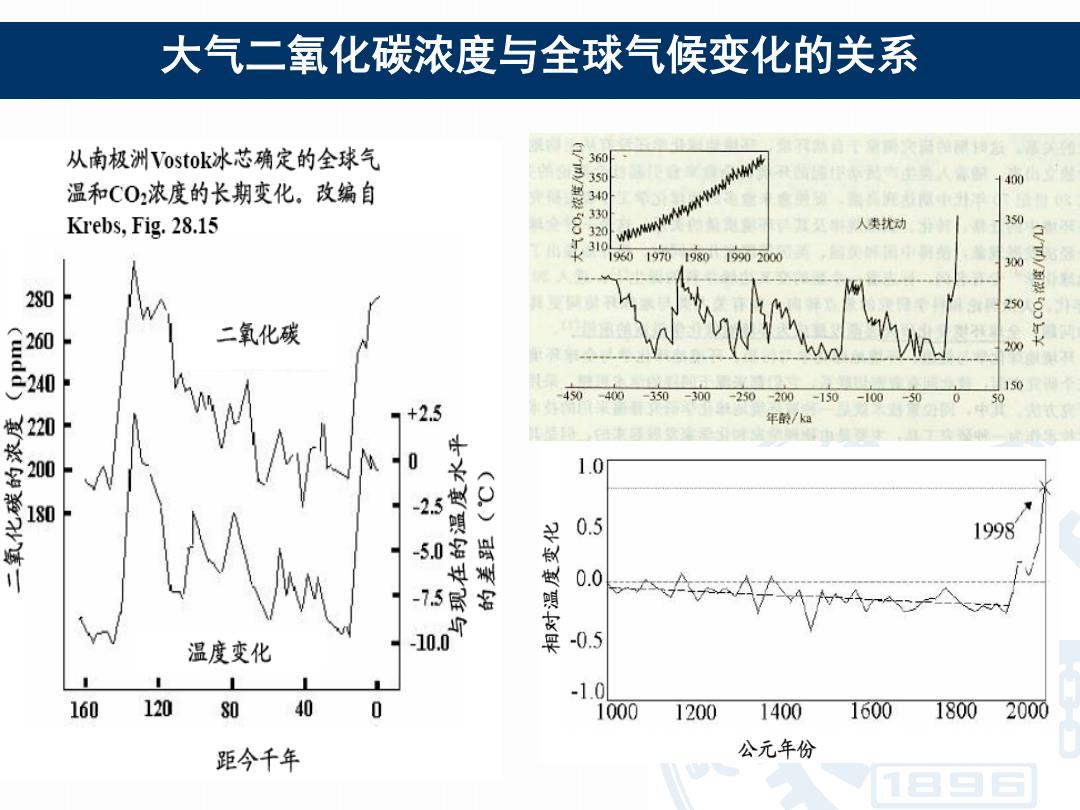
大气二氧化碳浓度与全球气候变化的关系 从南极洲Vostok.冰芯确定的全球气 400 温和C0,浓度的长期变化,改编自 Krebs,Fig.28.15 人类扰动 350 310 9601970198019902000 300 280 250 w 二氧化碳 200 150 450 400 -350-300-250-200-150 -100 +25 年酸/ka 20 1.0 -25 0.5 1998 5.0 0.0 -75 A 温度变化 -0.5 -1. 160 120 80 40 0 1000 1200 1400 160018002000 距今千年 公元年份
大气二氧化碳浓度与全球气候变化的关系

上游充通大¥ SHANGHAI JIAO TONG UNIVERSITY Indicators of the human influence on the atmosphere during the Industrial era CO2(ppm) Radiative forcing(Wm) NaOpp Radiative forcing (Wm) 360 Carbon Dioxide concentration 5 015 310-Nitrous Oxide concentration 340 10 010 320 290 0.05 300 2804:g 0.0 270.. 0.00 260 250+ 1000 1200 1400 1600 1800 2000 1000 1200 1400 1600 1800 2000 Sulfur CHaipp) Radiative forcing (Wm2) mg So per tonne of ice Sulfate aerosols 1750 Methane concentration 200 0.50 deposited in 1500 Greenland ice 50 SO,emissions 1250 from United States 025 and Europe 100 1000 (Mt S y) 35 750 0.00 1000 1200 1400 1600 1800 2000 1400 1600 1800 2000 SYR-FIGURE 2-1 WG1 FIGURE SPM-2 @ IPCC WMO UNEP 人类活动对大气组成的影响
人类活动对大气组成的影响

上浒充通大粤 SHANGHAI JIAO TONG UNIVERSITY Comparison between modeled and observations of temperature rise since the year 1860 Temperature anomalies inC Temperature anomalies inC 1.0 10 1.0 10 (a)Natural forcing only (b)Anthropogenic forcing only 05 0.5 0.5 0.5 0.0 0.0 0.0 0.0 -0.5 0.5 0.5 0.5 ■Model results Model results -Observations Observations -10 -1.0 1.0+ -10 1850 1900 1950 2000 1850 1900 1950 2000 Temperature anomalies inC 1.0 (c)Natural +Anthropogenic forcing 0.5 0.5 0.0 0.0 0.5 05 ■Model results Observations 10 1.0 SYR-FIGURE 2-4 IPCC WMO UNEP INTERGOVERNMENTAL PANEL ON CLIMATE CHANGE 1860年以来地表温度观察值与模拟值的比较
1860年以来地表温度观察值与模拟值的比较