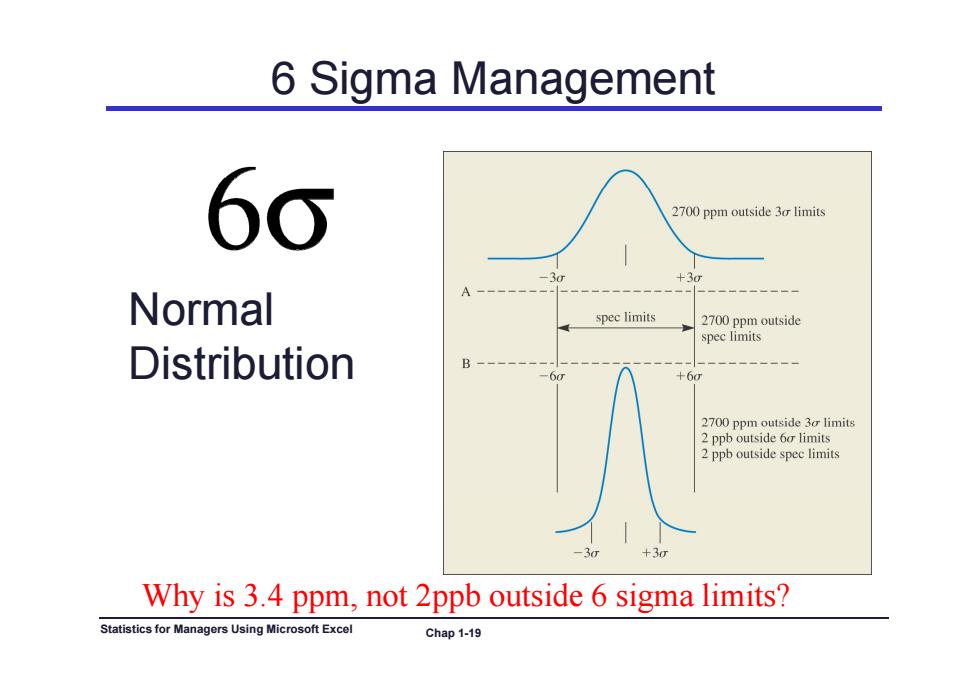
6 Sigma Management 60 2700 ppm outside 3 limits +30 一一一一 Normal spec limits 2700 ppm outside spec limits Distribution 一一一一一 +6 2700 ppm outside 3o limits 2 ppb outside 60 limits 2 ppb outside spec limits Why is 3.4 ppm,not 2ppb outside 6 sigma limits? Statistics for Managers Using Microsoft Excel Chap1-19
6 Sigma Management Normal Distribution Statistics for Managers Using Microsoft Excel Chap 1-19 Why is 3.4 ppm, not 2ppb outside 6 sigma limits?
60&3.4PPM If the quality characteristic being measured has a normal distribution with mean u and standard deviation o,then 3.4 parts per million is ■(a)the fraction that falls outside of u士3g ■(b)the fraction that falls outside of u±6o ■(c)the fraction that falls outside ofμ±4.5o (d)none of the above. Statistics for Managers Using Microsoft Excel Chap 1-20
6σ & 3.4PPM If the quality characteristic being measured has a normal distribution with mean normal distribution with mean μ and standard and standard deviation σ, then 3.4 parts per million is () f f f (a) the fraction that falls outside of μ ± 3σ (b) the fraction that falls outside of μ ± 6σ (c) the fraction that falls outside of μ ± 4.5σ (d) none of the above (d) none of the above. Statistics for Managers Using Microsoft Excel Chap 1-20
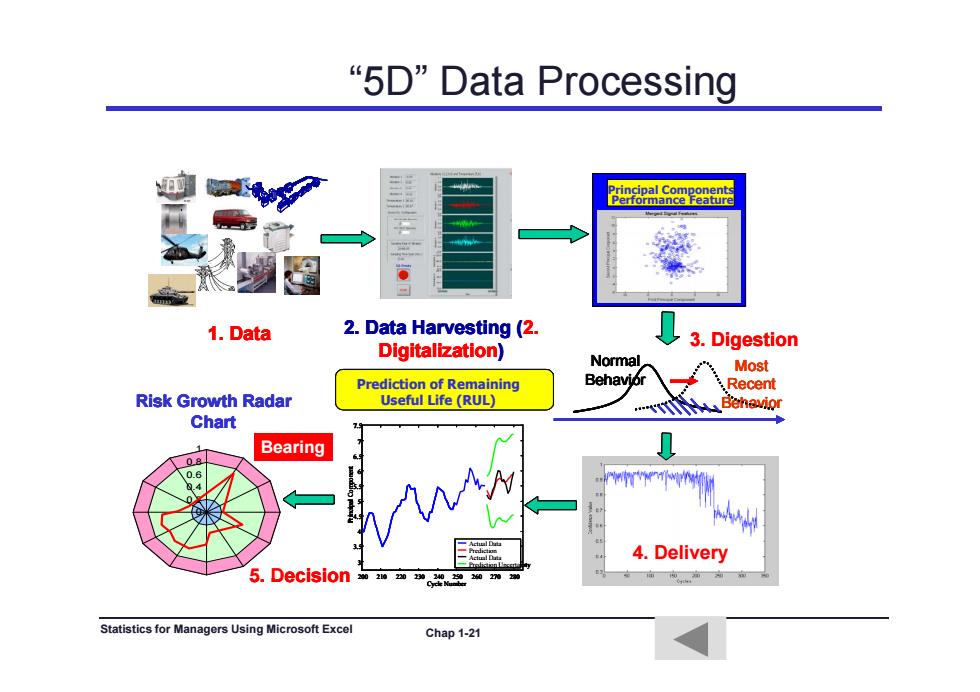
“5D”Data Processing P8S蓝 1.Data 2.Data Harvesting (2. Digitalization) 3.Digestion Normal Most Prediction of Remaining Recent Risk Growth Radar Useful Life(RUL) Chart Bearing 4.Delivery 5.Decision Statistics for Managers Using Microsoft Excel Chap 1-21
“5D” Data Processing Principal Components Principal Components Performance Feature 1. Data 3. Digestio n 2. Data Harvesting (2. Di it li ti ) 1. Data 3. Digestio n 2. Data Harvesting (2. Di it li ti ) 1. Data 2. Data Harvesting (2. Di it li ti ) 1. Data 2. Data Harvesting (2. Di it li ti ) 3 gest o 7 5 Prediction of Remaining Useful Life (RUL) Normal Behavior Most Recent Risk Growth Radar Behavior Chart Di git alization) 3 gest o 7 5 Prediction of Remaining Useful Life (RUL) Normal Behavior Most Recent Risk Growth Radar Behavior Chart Di git alization) 7 5 Prediction of Remaining Useful Life (RUL) Normal Behavior Most Recent Risk Growth Radar Behavior Chart Di git alization) Prediction of Remaining Useful Life (RUL) Normal Behavior Most Recent Risk Growth Radar Behavior Chart Di git alization) 5 5.5 6 6.5 7 7.5 al Component Chart 0.2 0.4 0.6 0.8 1 Bearing 5 5.5 6 6.5 7 7.5 al Component Chart 0.2 0.4 0.6 0.8 1 Bearing 5 5.5 6 6.5 7 7.5 al Component 5 5.5 6 6.5 7 7.5 al Component Chart 0.2 0.4 0.6 0.8 1 Bearing Chart 0.2 0.4 0.6 0.8 1 Bearing 200 210 220 230 240 250 260 270 280 3 3.5 4 4.5 5 C lN b Principa Actual Data Prediction Actual Data Prediction Uncertainty 0 0.2 4. Delivery 5. Decision 200 210 220 230 240 250 260 270 280 3 3.5 4 4.5 5 C lN b Principa Actual Data Prediction Actual Data Prediction Uncertainty 0 0.2 4. Delivery 5. Decision 200 210 220 230 240 250 260 270 280 3 3.5 4 4.5 5 C lN b Principa Actual Data Prediction Actual Data Prediction Uncertainty 200 210 220 230 240 250 260 270 280 3 3.5 4 4.5 5 C lN b Principa Actual Data Prediction Actual Data Prediction Uncertainty 0 0.2 4. Delivery 5. Decision Statistics for Managers Using Microsoft Excel Chap 1-21 5 Cycle Number 5. Decision Cycle Number 5. Decision Cycle Number . Decision
Problem of Sampling >Assume that you want to make a survey to investigate the consumption habit of female about make-up in Shanghai,how many people should you ask?How the number of the sample affect the conclusion?What is the confidence of the conclusion? Statistics for Managers Using Microsoft Excel Chap 1-22
Problem of Sampling Assume that you want to make a survey t i ti t th to investiga te the consumption habit of female about consumption habit of female about make-up in Shanghai, how many peopl h ld k? H th le s hould you ask? How the number of the sam ple affect the conclusion? What is the confidence of the conclusion? confidence of the conclusion? Statistics for Managers Using Microsoft Excel Chap 1-22