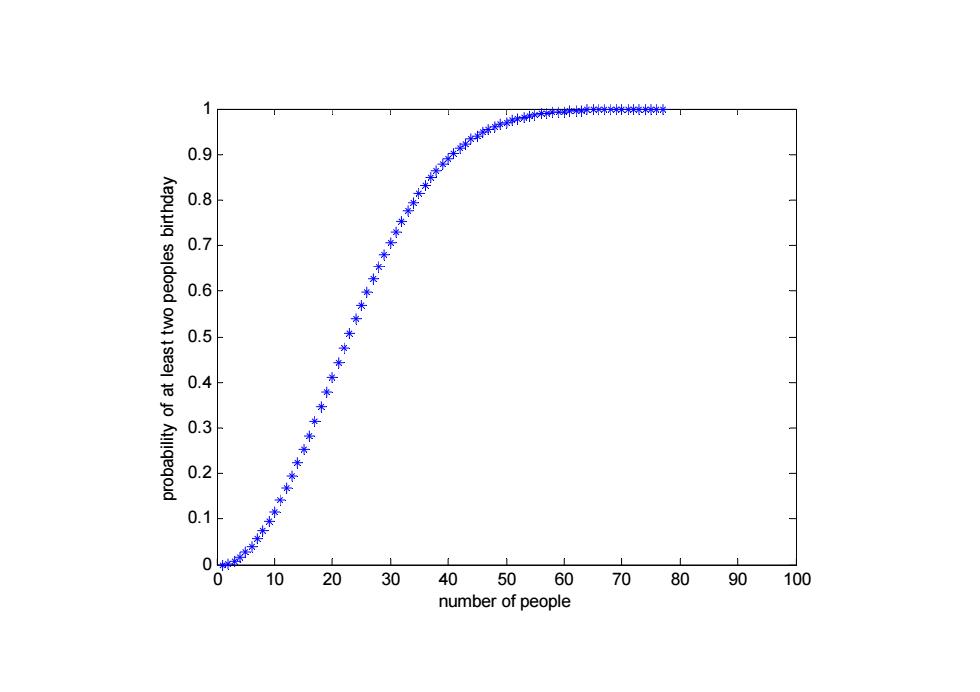
1 米】 0.6 4 0.3 2 0.1 0 10 20 30 40 5060 70 80 90 100 number of people
1 0.9 ay 0.7 0.8 ples birthda 0.5 0.6 t two peop 0 3 0.4 y of at leas 0.2 0.3 probability 0 10 20 30 40 50 60 70 80 90 100 0 0.1 0 10 20 30 40 50 60 70 80 90 100 number of people
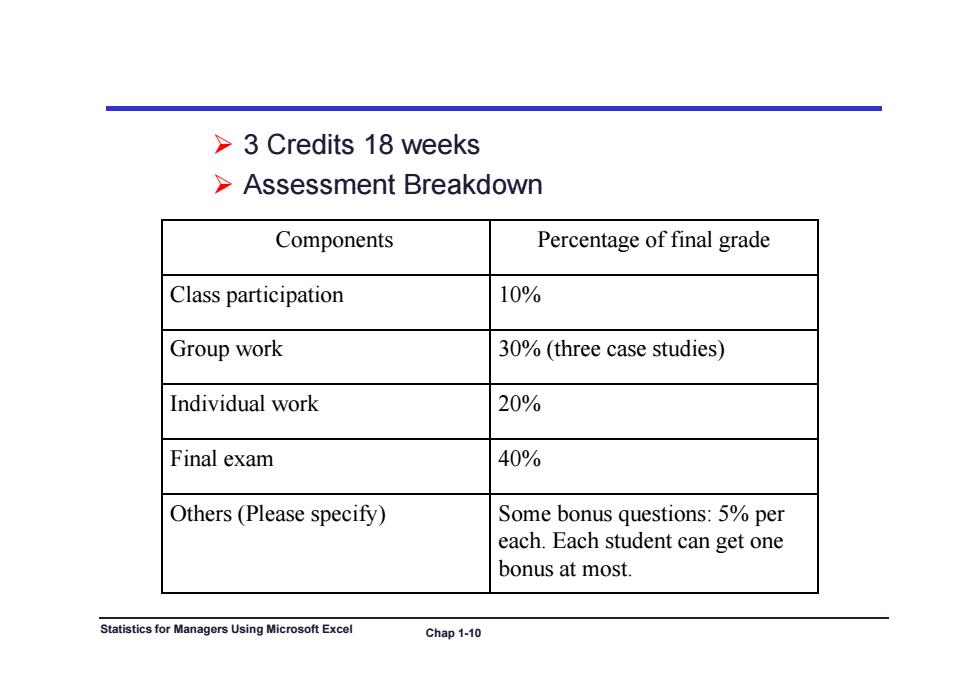
>3 Credits 18 weeks >Assessment Breakdown Components Percentage of final grade Class participation 10% Group work 30%(three case studies) Individual work 20% Final exam 40% Others(Please specify) Some bonus questions:5%per each.Each student can get one bonus at most. Statistics for Managers Using Microsoft Excel Chap 1-10
3 Credits 18 weeks Assessment Breakdown Assessment Breakdown Components Percentage of final grade Class participation 10% Gro p ork Group work 30% (three case st dies) 30% (three case studies) Individual work 20% Final exam 40% Others (Please specify) Some bonus questions: 5% per each. Each student can get one bonus at most. Statistics for Managers Using Microsoft Excel Chap 1-10
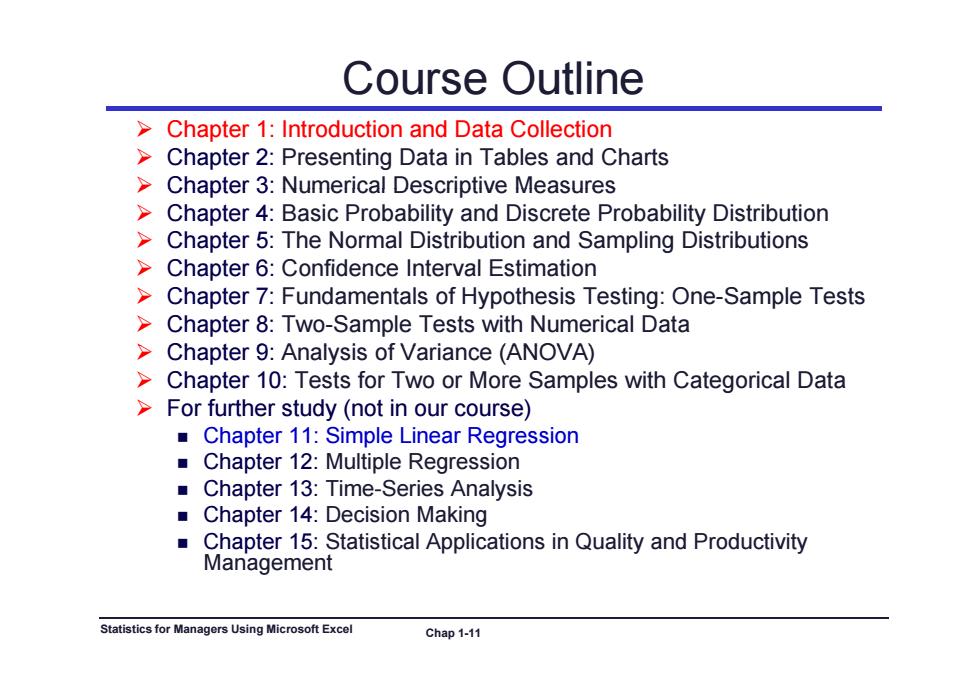
Course Outline >Chapter 1:Introduction and Data Collection Chapter 2:Presenting Data in Tables and Charts >Chapter 3:Numerical Descriptive Measures Chapter 4:Basic Probability and Discrete Probability Distribution >Chapter 5:The Normal Distribution and Sampling Distributions Chapter 6:Confidence Interval Estimation > Chapter 7:Fundamentals of Hypothesis Testing:One-Sample Tests >Chapter 8:Two-Sample Tests with Numerical Data >Chapter 9:Analysis of Variance(ANOVA) >Chapter 10:Tests for Two or More Samples with Categorical Data >For further study(not in our course) Chapter 11:Simple Linear Regression Chapter 12:Multiple Regression ■ Chapter 13:Time-Series Analysis ■ Chapter 14:Decision Making Chapter 15:Statistical Applications in Quality and Productivity Management Statistics for Managers Using Microsoft Excel Chap 1-11
Course Outline Chapter 1: Introduction and Data Collection Chapter 2: Presenting Data in Tables and Charts Chapter 3: Chapter 3: Numerical Descriptive Measures Numerical Descriptive Measures Chapter 4: Basic Probability and Discrete Probability Distribution Chapter 5: The Normal Distribution and Sampling Distributions Chapter 6: Chapter 6: Confidence Interval Estimation Confidence Interval Estimation Chapter 7: Fundamentals of Hypothesis Testing: One-Sample Tests Chapter 8: Two-Sample Tests with Numerical Data Ch t 9 ap ter 9: A l i f V i (ANOVA) Analysis o f Variance (ANOVA) Chapter 10: Tests for Two or More Samples with Categorical Data For further study (not in our course) Chapter 11: Simple Linear Regression Chapter 12: Multiple Regression Chapter 13: Time-Series Analysis Chapter 14: Decision Making Chapter 15: Statistical Applications in Quality and Productivity Management Statistics for Managers Using Microsoft Excel Chap 1-11
Learning Objectives In this chapter, you will learn: . Why statistics is important . How statistics is used in business . The sources of data used in business The types of data used in business The key terms The basics of Microsoft Excel Statistics for Managers Using Microsoft Excel Chap 1-12
Learning Objectives In this chapter, you will learn: Why statistics is important How statistics is used in business Th e sou ces o data used bus ess sou rces of data used in business The types of data used in business Th k t e key terms The basics of Microsoft Excel Statistics for Managers Using Microsoft Excel Chap 1-12
What is Statistics >Statistics:the science of collecting,analyzing, presenting,and interpreting data. Copyright 1994-2000 Encyclopaedia Britannica,Inc. Statistics for Managers Using Microsoft Excel Chap 1-13
What is Statistics Statistics: the science of collecting, analyzing, presenti di i ng, an d interpret ing data . Copyright 1994-2000 Encyclopaedia Britannica, Inc. Statistics for Managers Using Microsoft Excel Chap 1-13