
Interpretation of the Intercept and the Slope bo is the estimated mean value of Y when the value of X is zero b is the estimated change in the mean value of Y for every one-unit change in X
Interpretation of the Intercept and the Slope b 0 is the estimated mean value of Y when the value of X is zero b 1 is the estimated change in the mean value of Y for every one-unit change in X
Linear Regression Example A real estate agent wishes to examine the relationship between the selling price of a home and its size(measured in square feet) A random sample of 10 houses is selected .Dependent variable (Y)=house price in $1000s Independent variable (X)=square feet
Linear Regression Example A real estate agent wishes to examine the relationship between the selling price of a home and its size (measured in square feet) A random sample of 10 houses is selected Dependent variable (Y) = house price in $1000s Independent variable (X) = square feet

Linear Regression Example Data House Price in $1000s Square Feet (Y) (X) 245 1400 312 1600 279 1700 308 1875 199 1100 219 1550 405 2350 324 2450 319 1425 255 1700
Linear Regression Example Data House Price in $1000s (Y) Square Feet (X) 245 1400 312 1600 279 1700 308 1875 199 1100 219 1550 405 2350 324 2450 319 1425 255 1700
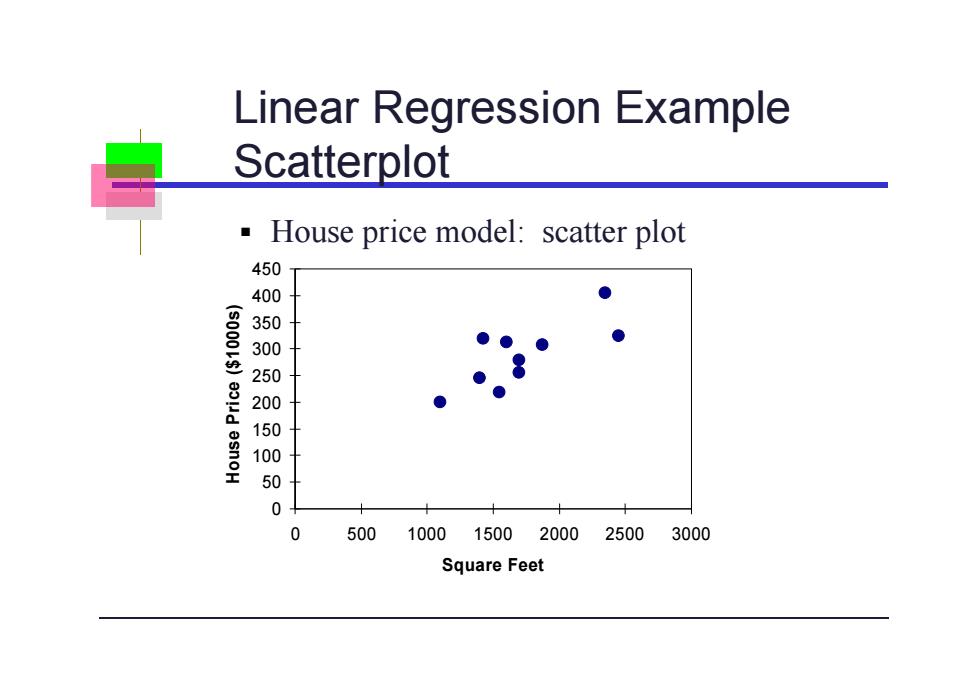
Linear Regression Example Scatterplot House price model:scatter plot 450 400 268 何00 0 0 500 10001500200025003000 Square Feet
Linear Regression Example Scatterplot 0 50 100 150 200 250 300 350 400 450 0 500 1000 1500 2000 2500 3000 Square Feet House Price ($1000s) House price model: scatter plot

Linear Regression Example Using Excel Micros Excel-1data 国Ele Edt yew Insert Format Iools Data业ndow Acroa D它日國每Qy为B自·$口·,唱工·不R!恤利0%日回4置甲 Tools 可B1卫售喜国$%,88安四·公·△·⑧Q型它 Chart 1 Regression A Input- Data Analysis House Price Square Feet OK Input YRange A51:11 245 1400 Cancel Input XRange: 01:11 312 1600 Labels] 厂sZero Help Regression 279 1700 308 1875 厂Confidence Level: 5% 6 199 1100 Output options 1 219 1550 Output Range: 8 405 2350 New Worksheet Bly 324 2450 Residuals 0 319 1425 ■Residuals Residual Plots 255 1700 Standardzed Residuals Lne Ft Plots Normal Probablty 5
Linear Regression Example Using Excel Tools -------- Data Analysis -------- Regression