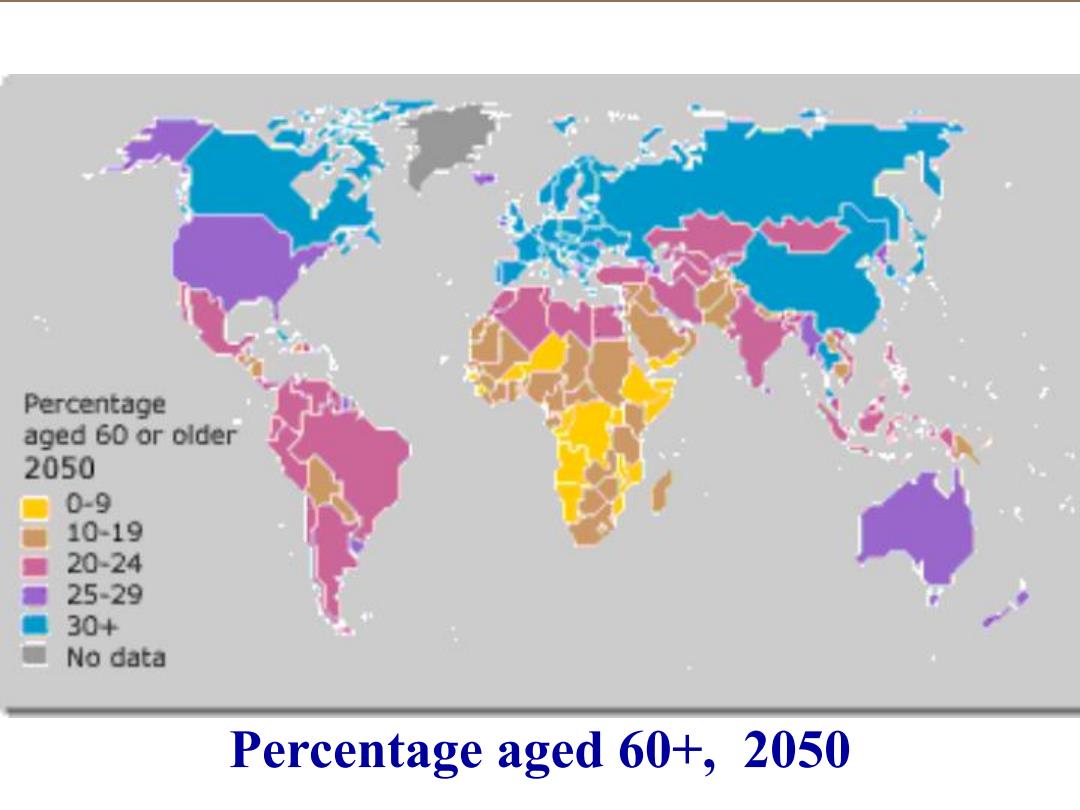
Percentage aged 60 or older 2050 0-9 10-19 是 20-24 25-29 30+ No data Percentage aged 60+,2050
Percentage aged 60+, 2050
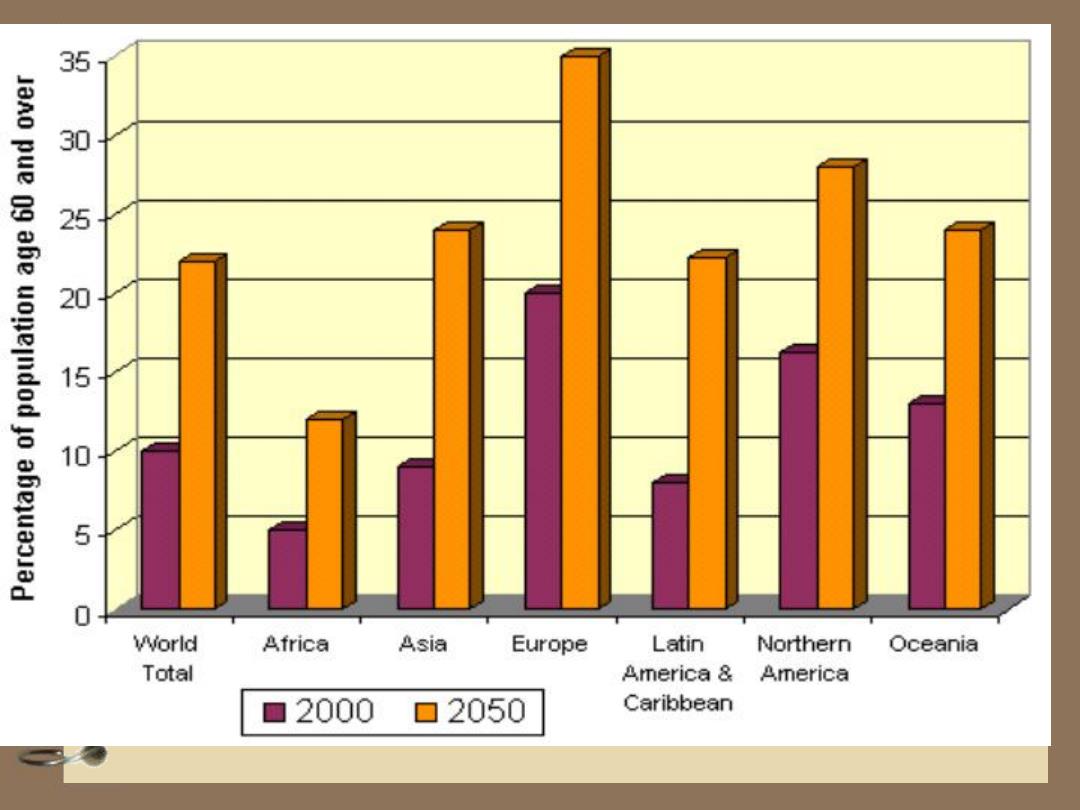
5050610 5 0 World Africa Asia Europe Latin Northern Oceania Total America America ■2000 ▣2050 Caribbean
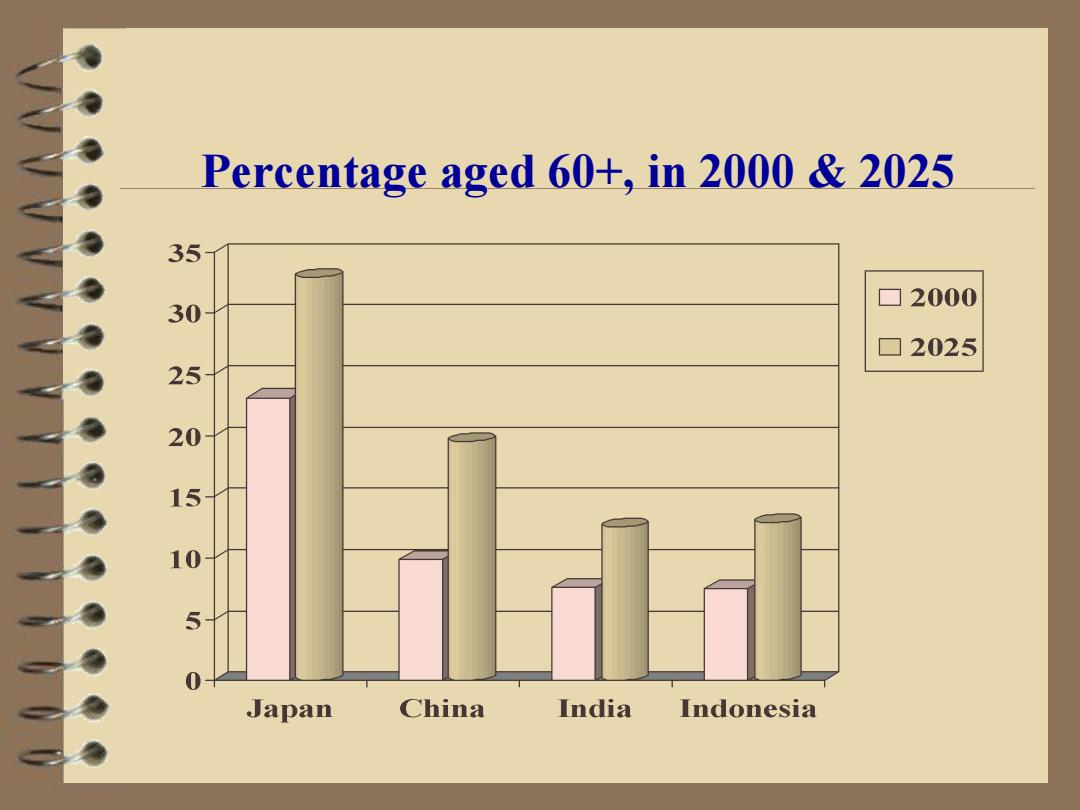
Percentage aged 60+,in 2000 2025 35 □2000 050150 ▣2025 5 Japan China India Indonesia
Percentage aged 60+, in 2000 & 2025
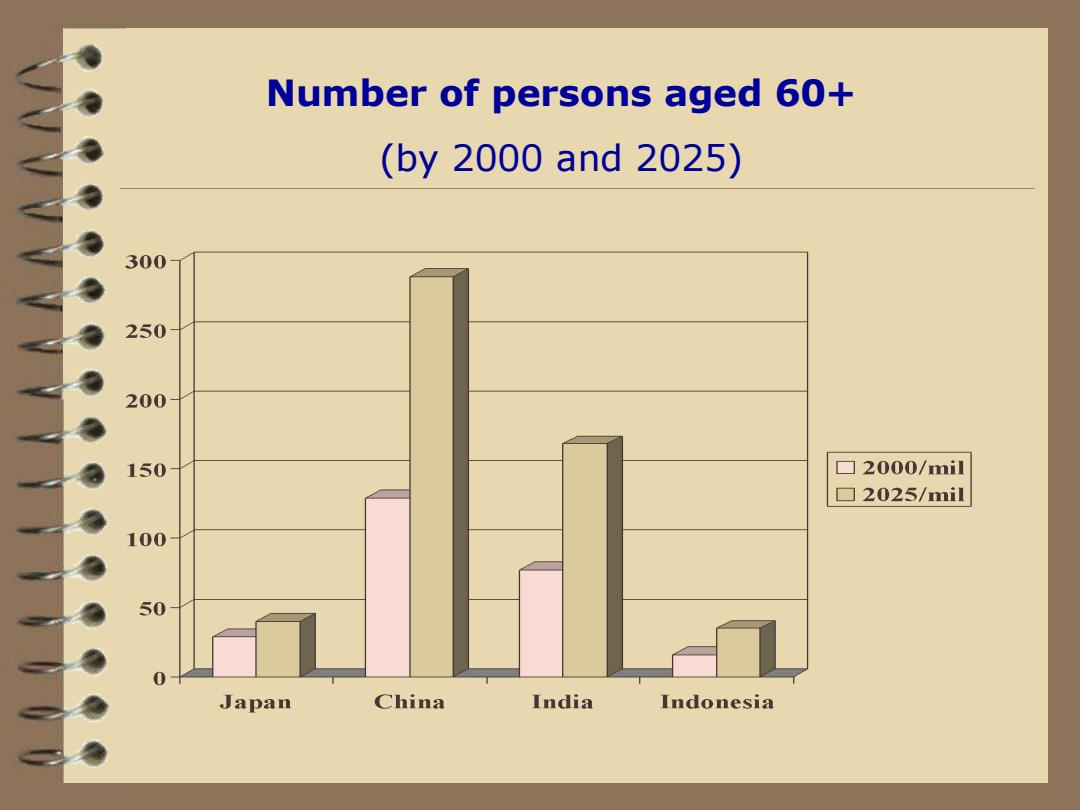
Number of persons aged 60+ (by2000and2025) 300 250 200 150 ▣2000/mil □2025/mil 100 50 Japan China India Indonesia
Number of persons aged 60+ (by 2000 and 2025)

全亞洲趨勢 60歲或以上老年人口比例的預测 國家/地區 2000(%) 2025(%) 2050(%) 日本 23.2 35.1 42.3 韓國 11.0 24.1 33.2 新加坡 10.6 30.0 35.0 泰國 8.1 17.1 27.1 中國内地 10.1 19.5 29.9 中國上海 18.16 37.91 40.3(2040) 中國香港 14.3 28.2 35.4 中國澳門 9.7 29.4 38.4 套來源:United Nation Economic and Social Commission for Asia and the Pacific(2002)
全亞洲趨勢: 60歲或以上老年人口比例的預測 國家/地區 2000 (%) 2025 (%) 2050 (%) 日本 23.2 35.1 42.3 韓國 11.0 24.1 33.2 新加坡 10.6 30.0 35.0 泰國 8.1 17.1 27.1 中國內地 10.1 19.5 29.9 中國香港 14.3 28.2 35.4 中國澳門 9.7 29.4 38.4 資料來源:United Nation Economic and Social Commission for Asia and the Pacific (2002) 中國上海 18.16 37.91 40.3(2040)