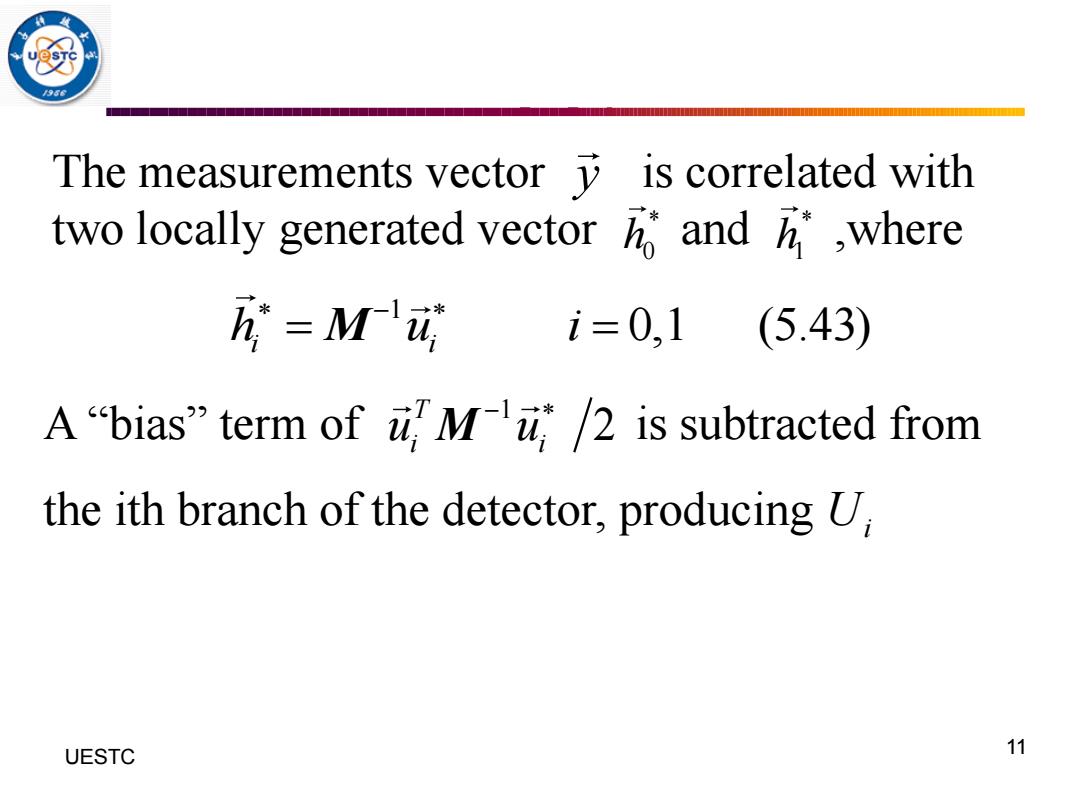
The measurements vector is correlated with two locally generated vector and h,where 万=M'成 i=0,1 (5.43) A"bias"term of .M/2 is subtracted from the ith branch of the detector,producing U, UESTC 11
11 UESTC The measurements vector is correlated with two locally generated vector and ,where y * 0 h * 1 h 1 0,1 (5.43) i i h u i − = = M A “bias” term of is subtracted from the ith branch of the detector, producing 1 2 T i i u u − M Ui

Furthermore,if the underlying noise process is white with o2=o2/2,then each of the correlator terms is i=0,1 (5.45) And the bias terms are 2o24'4, i=0,1 (5.46) UESTC 12
12 UESTC Furthermore, if the underlying noise process is white with , then each of the correlator terms is And the bias terms are 2 2 2 = z 2 1 , 0,1 (5.45) i i h u i = = 2 1 , 0,1 (5.46) 2 T i i u u i =

MAC Real forms dot product part 房=la2 办训好 Choose largest MAC forms dot Real product part =o2 动瑞访 Figure 5.3.Functional block diagram of optimal correlator receiver in AWGN UESTC 13
13 UESTC

5.6 Filtering alternatives We consider the measurement column vector as a sampled time sequence )=[y]=[y1,2,,k] (5.47) Then an alternative structure to the correlator is a digital filter.Figure 5.4 shows a finite impulse response (FIR)filter whose tap coefficients are 所,A12,瓦1 (5.48) UESTC 14
14 UESTC 5.6 Filtering alternatives We consider the measurement column vector as a sampled time sequence 1 2 [ ] [ , , , ] (5.47) T k y y y y y = = Then an alternative structure to the correlator is a digital filter. Figure 5.4 shows a finite impulse response (FIR) filter whose tap coefficients are 0, 0, 1 0,2 0,1 , , , (5.48) k k h h h h −

/936 T Ts ho,k-1 →⑧☒ hot →⑧ Output Figure 5.4. FIR filter matched toh UESTC 15
15 UESTC